02 Networth.pro — wealth forecasting web app, 2026
All workForecast your net worth and compare every scenario
Designing a financial modelling product that turns expenses, income, assets and legal entities into an editable, long-term net worth forecast.
- Role
- UX/UI Designer
- Team
- UX/UI Designer (me)FounderEngineering
- Focus
- Product DesignOnboardingDesign System
- Scope
- Landing page to end-to-end web app
- Status
- In development
01 Overview
Building a forecast you can edit, not just read.
I worked on Networth.pro, a financial modelling tool that projects how someone's net worth will change over the coming decades. Users enter their expenses, income, assets, liabilities and insurance, and the product turns them into a year-by-year forecast over a horizon you choose, from a few years to several decades.
I designed the product end to end: the marketing landing page, sign up and onboarding, the scenario workspace, scenario management, ownership entities such as trusts and LLCs, and settings. I also built the component library that ties them together.
02 Where it started
Starting from a calculator and one screen.
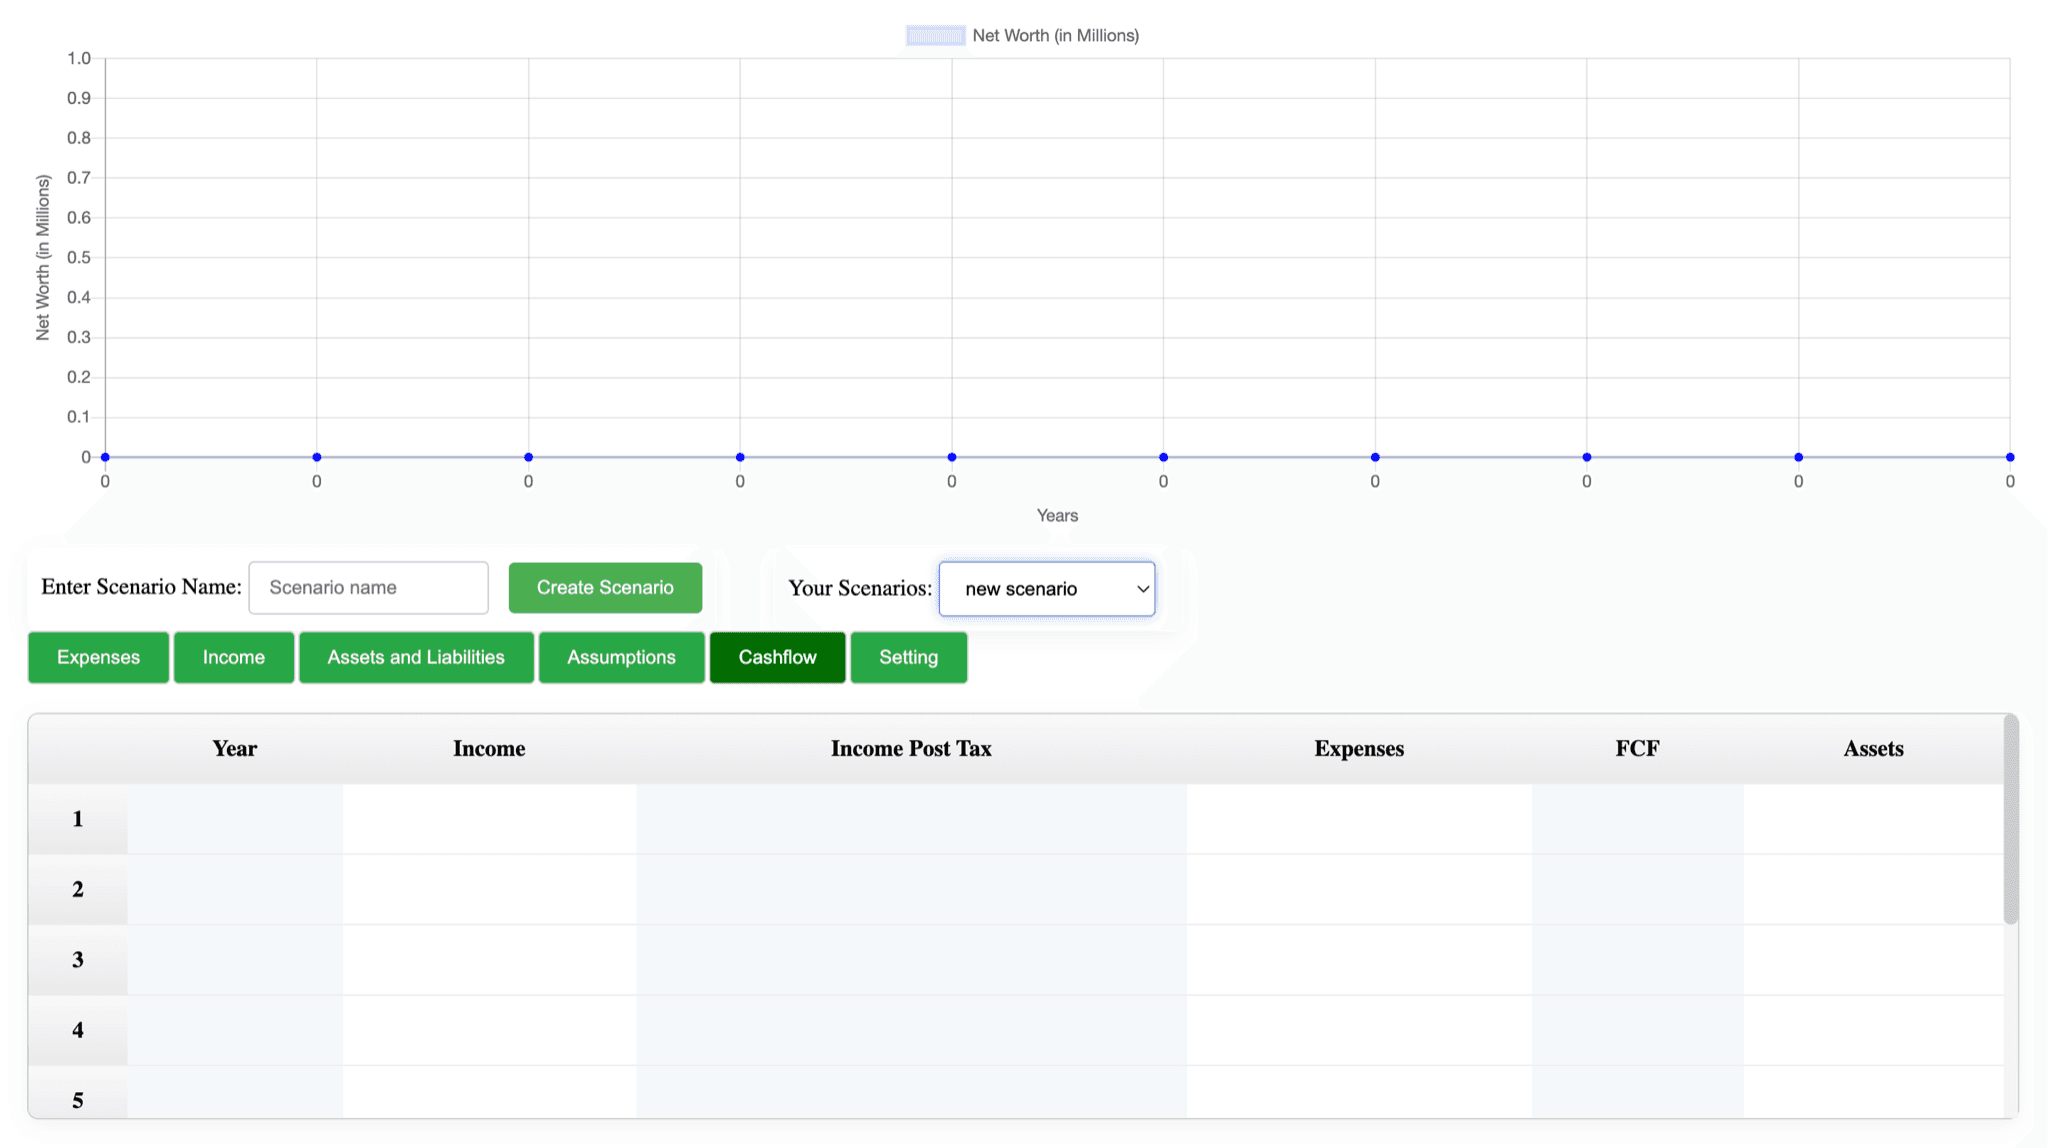
Engineering built the first version before design joined. It worked like a spreadsheet with a chart on top: a text box to name a scenario, a dropdown to switch between them, a row of green tab buttons, and a chart that sat flat at zero until you typed something in. I got that one screen and a short brief. The product should help people project their net worth and test different scenarios. That was all of it, so I started there.
Version one
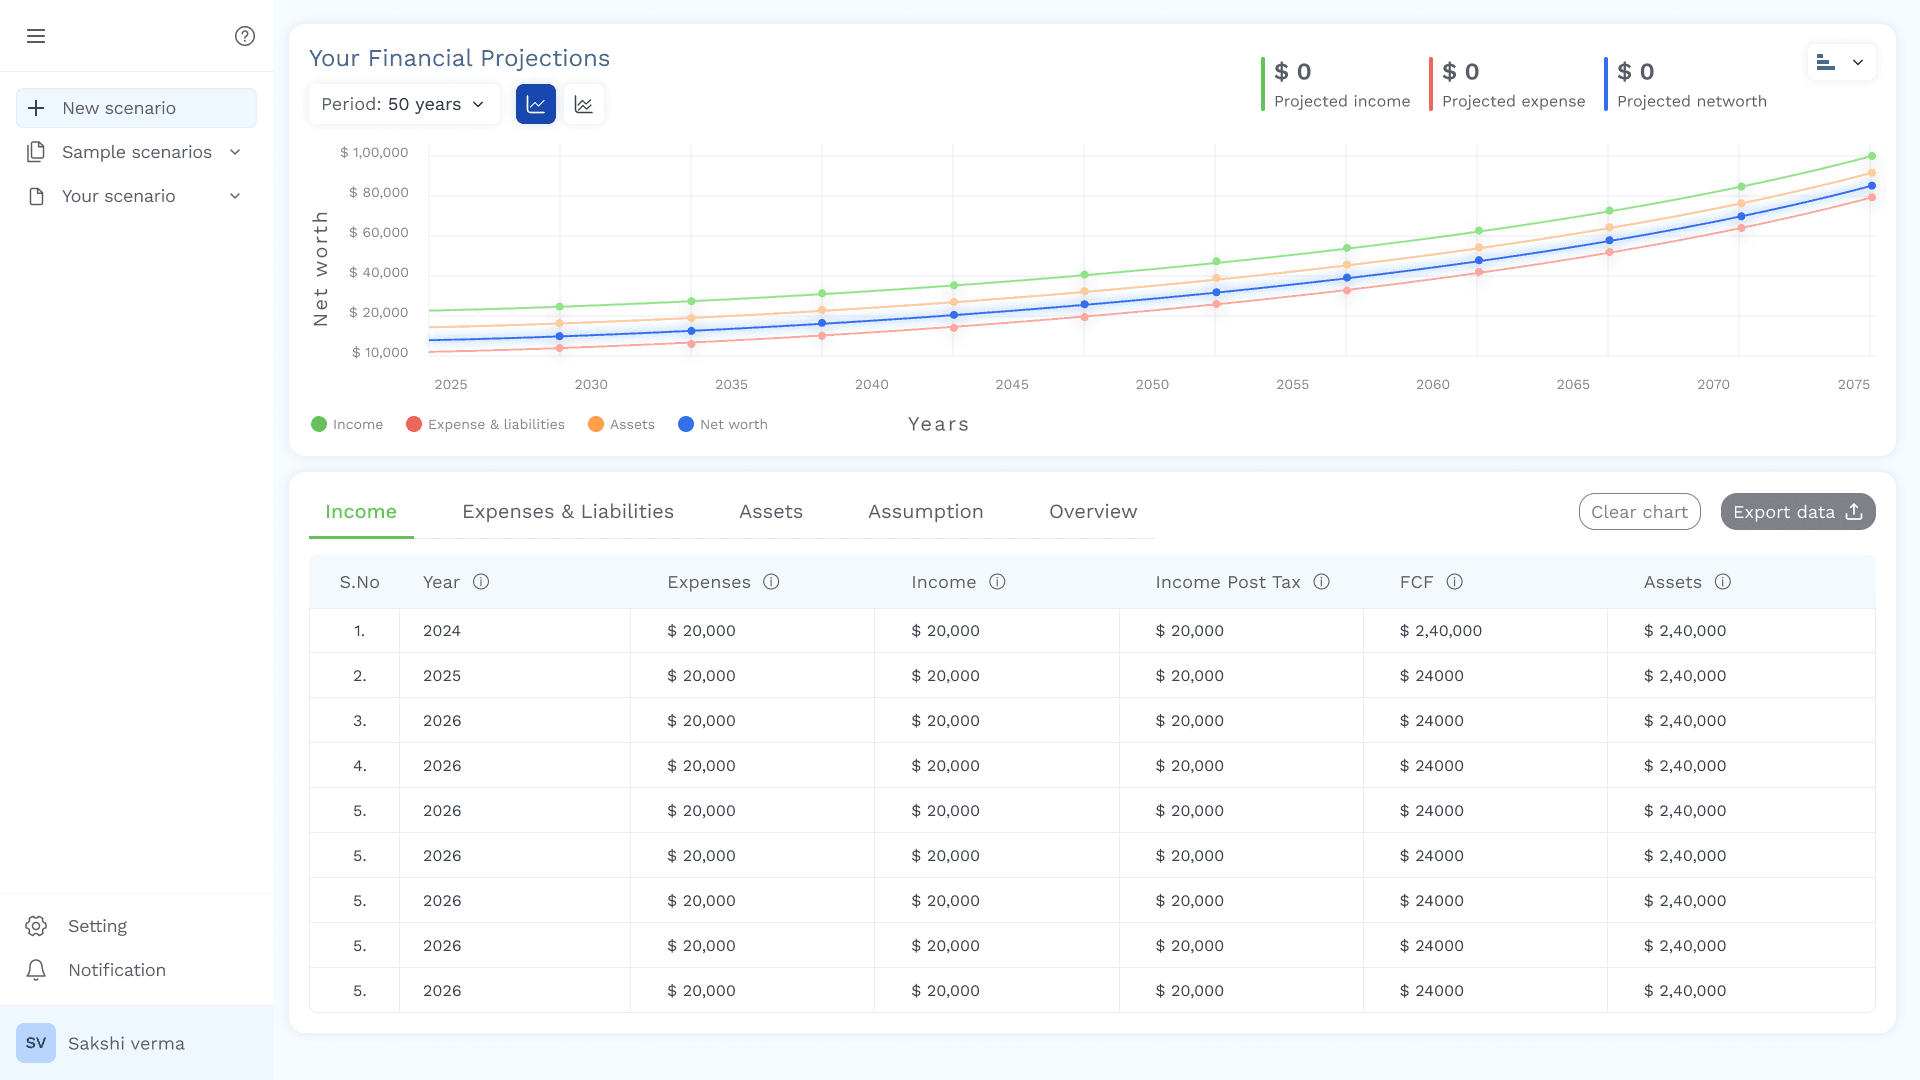
My first pass was blue and white and fixed the obvious things: the chart above the table, scenarios in a sidebar, one control for the projection period. Using it showed three problems.
- 01
You couldn't tell what to type and what the product worked out. Net worth and cashflow are calculated, and everything else is entered by hand. Version one treated them all the same.
- 02
The table never summed up.
- 03
It looked like every other finance tool. Founder feedback: black, white and blue is the whole category's look, and this product should feel more lively.
What I changed
- 01
Inputs and outputs split
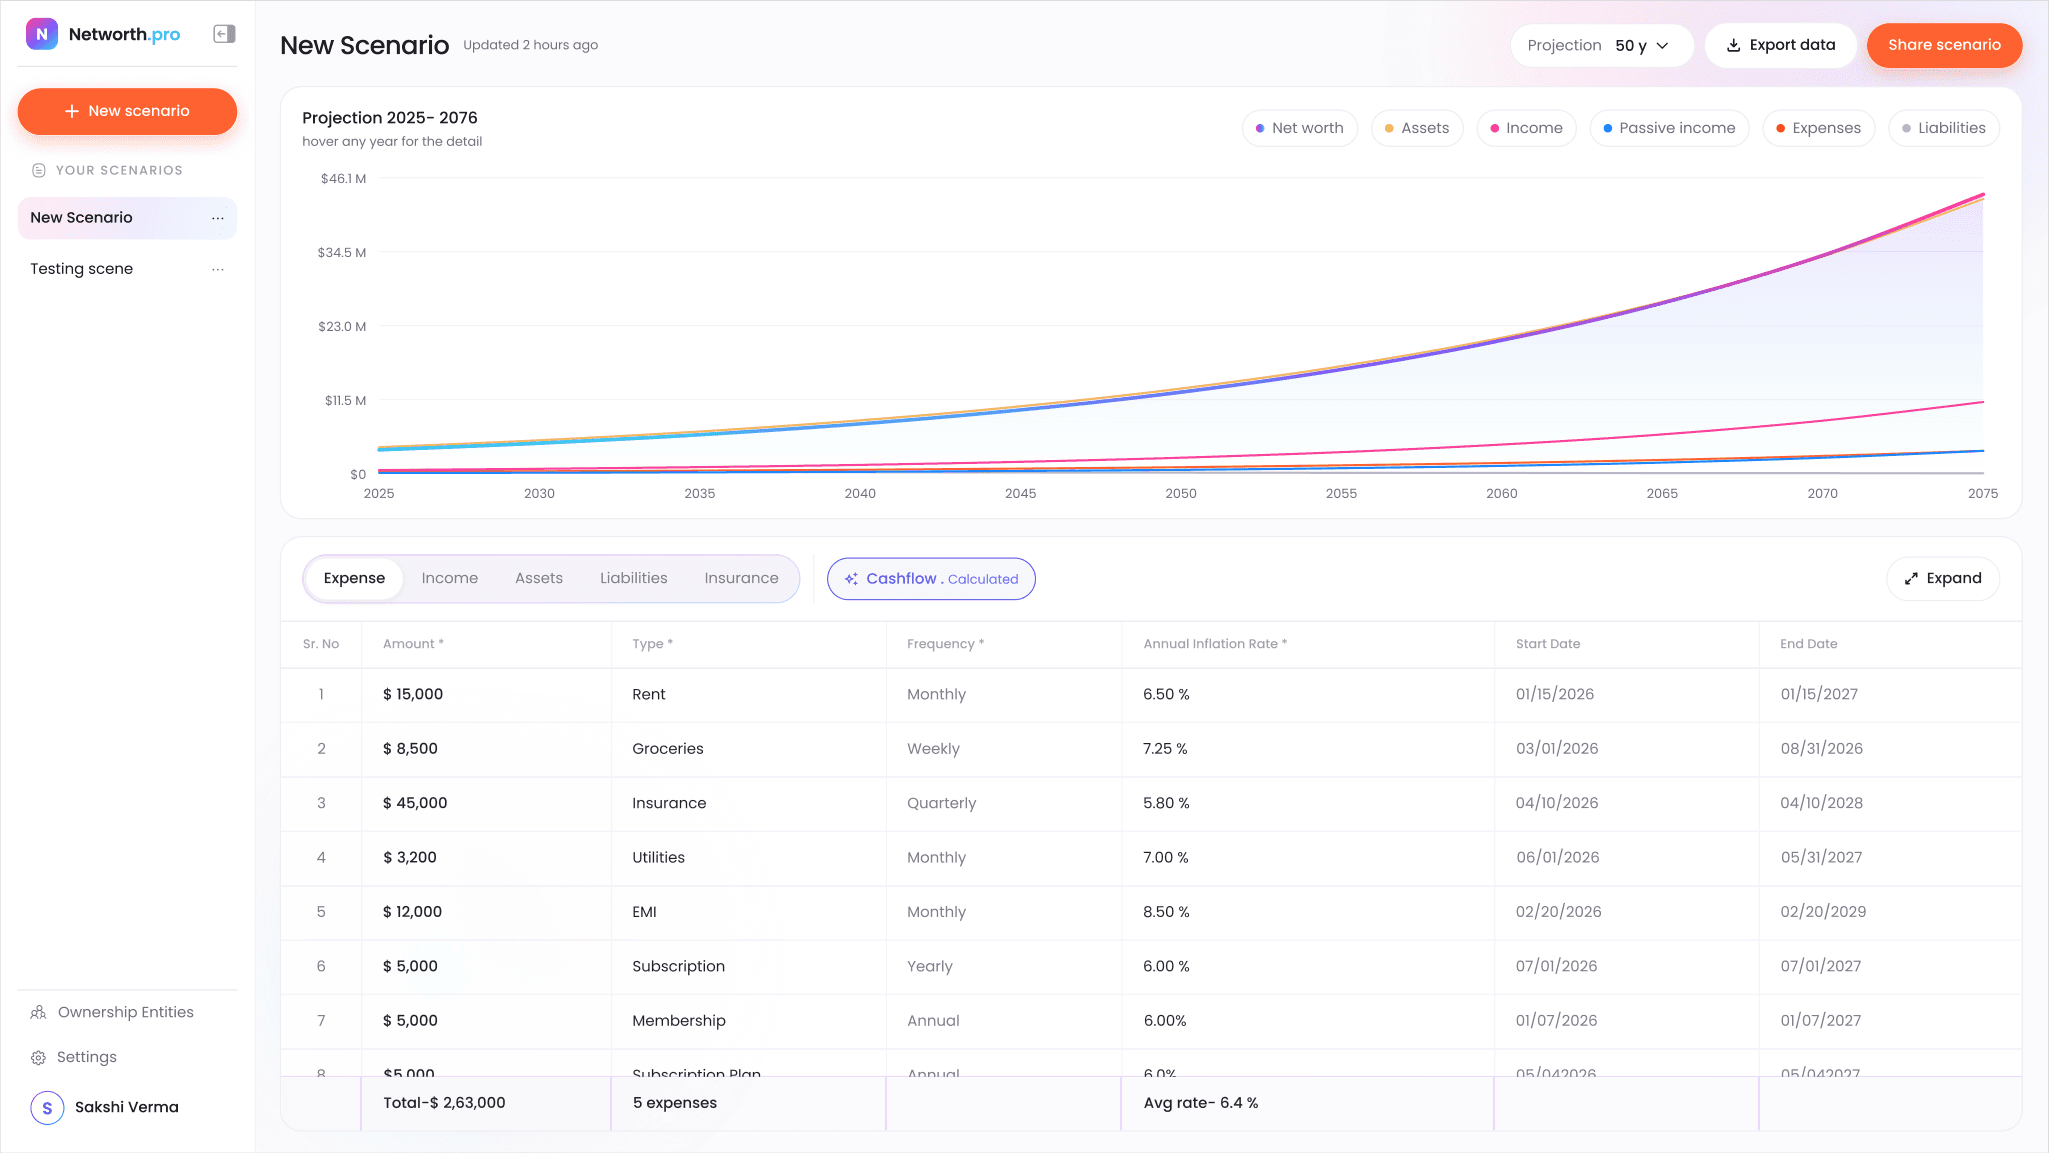
Typed data lives in five tabs: Expense, Income, Assets, Liabilities and Insurance. Cashflow sits apart as a gradient pill marked "Calculated".
- 02
A pinned totals row
Each column's total stays at the bottom while the rows scroll above it.
- 03
Colour with a job
Every line has its own colour, carried through the chart and the legend chips.
03 The challenge
Working with data that's dense, long-term and personal.
How I planned to keep a data-heavy product readable.
- AA forecast depends on dozens of inputs, each with an amount, frequency, inflation rate and date range.So I put the table and the projection on one screen, so every edit shows in the forecast right away.
- BThe output can span decades and plots six lines: net worth, assets, income, passive income, expenses and liabilities.So I added legend chips that switch each line on and off.
- CPeople want to compare what-ifs, so one plan is never enough.So I made creating, duplicating, renaming and sharing a scenario one or two clicks each.
- DWealthier users hold assets through trusts, LLCs and foundations, and each has its own legal detail.So I turned long legal forms into short steps that only ask for what applies.
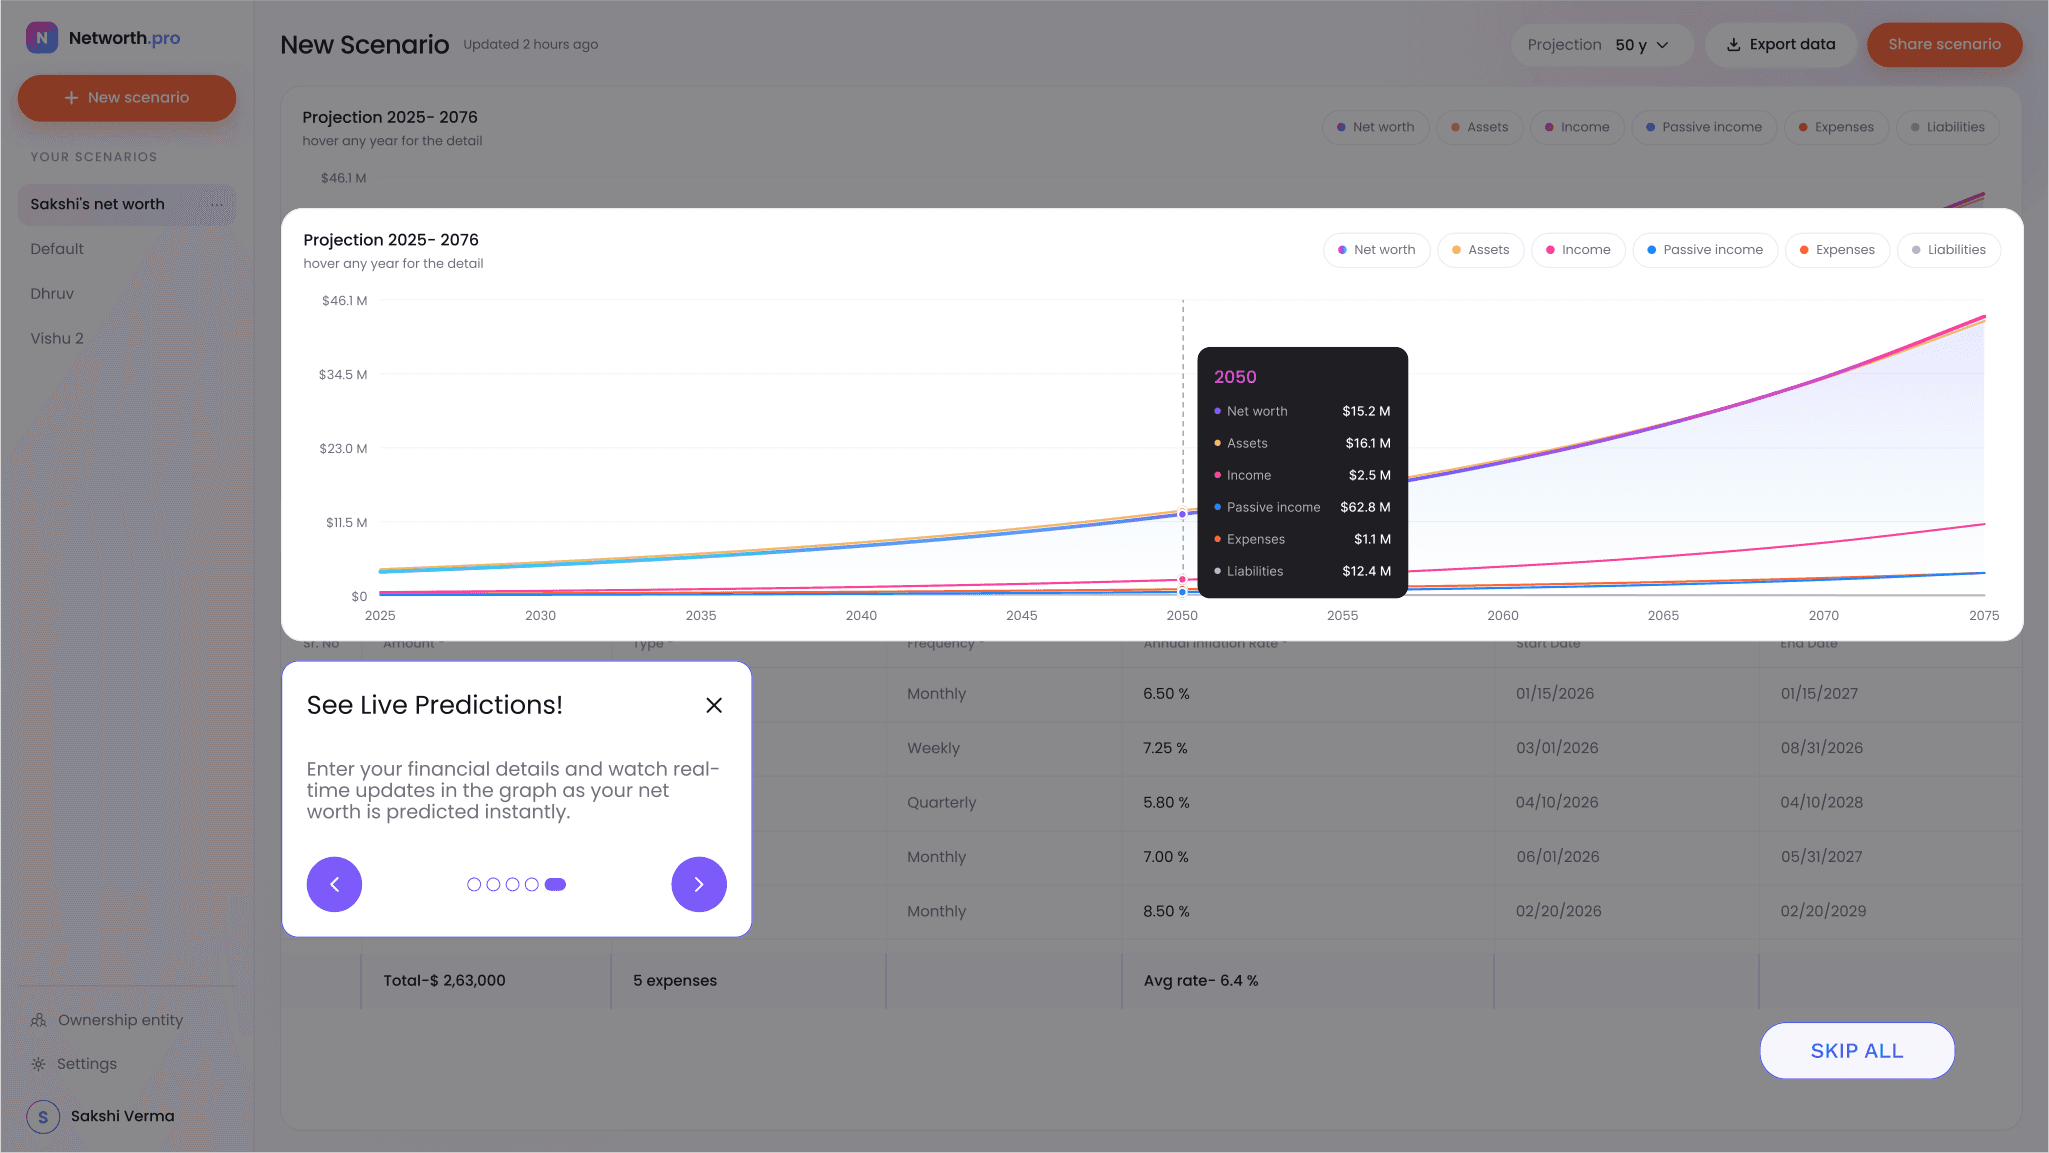
- EFirst-time users need to understand the workspace before they have any data in it.So I taught the workspace with coach marks on the real interface, not a separate tutorial.
- FNothing in version one showed what you type and what the product works out.So I gave calculated output its own look. Cashflow sits apart as a gradient pill marked Calculated.
04 Landing & sign up
Promising the outcome first.
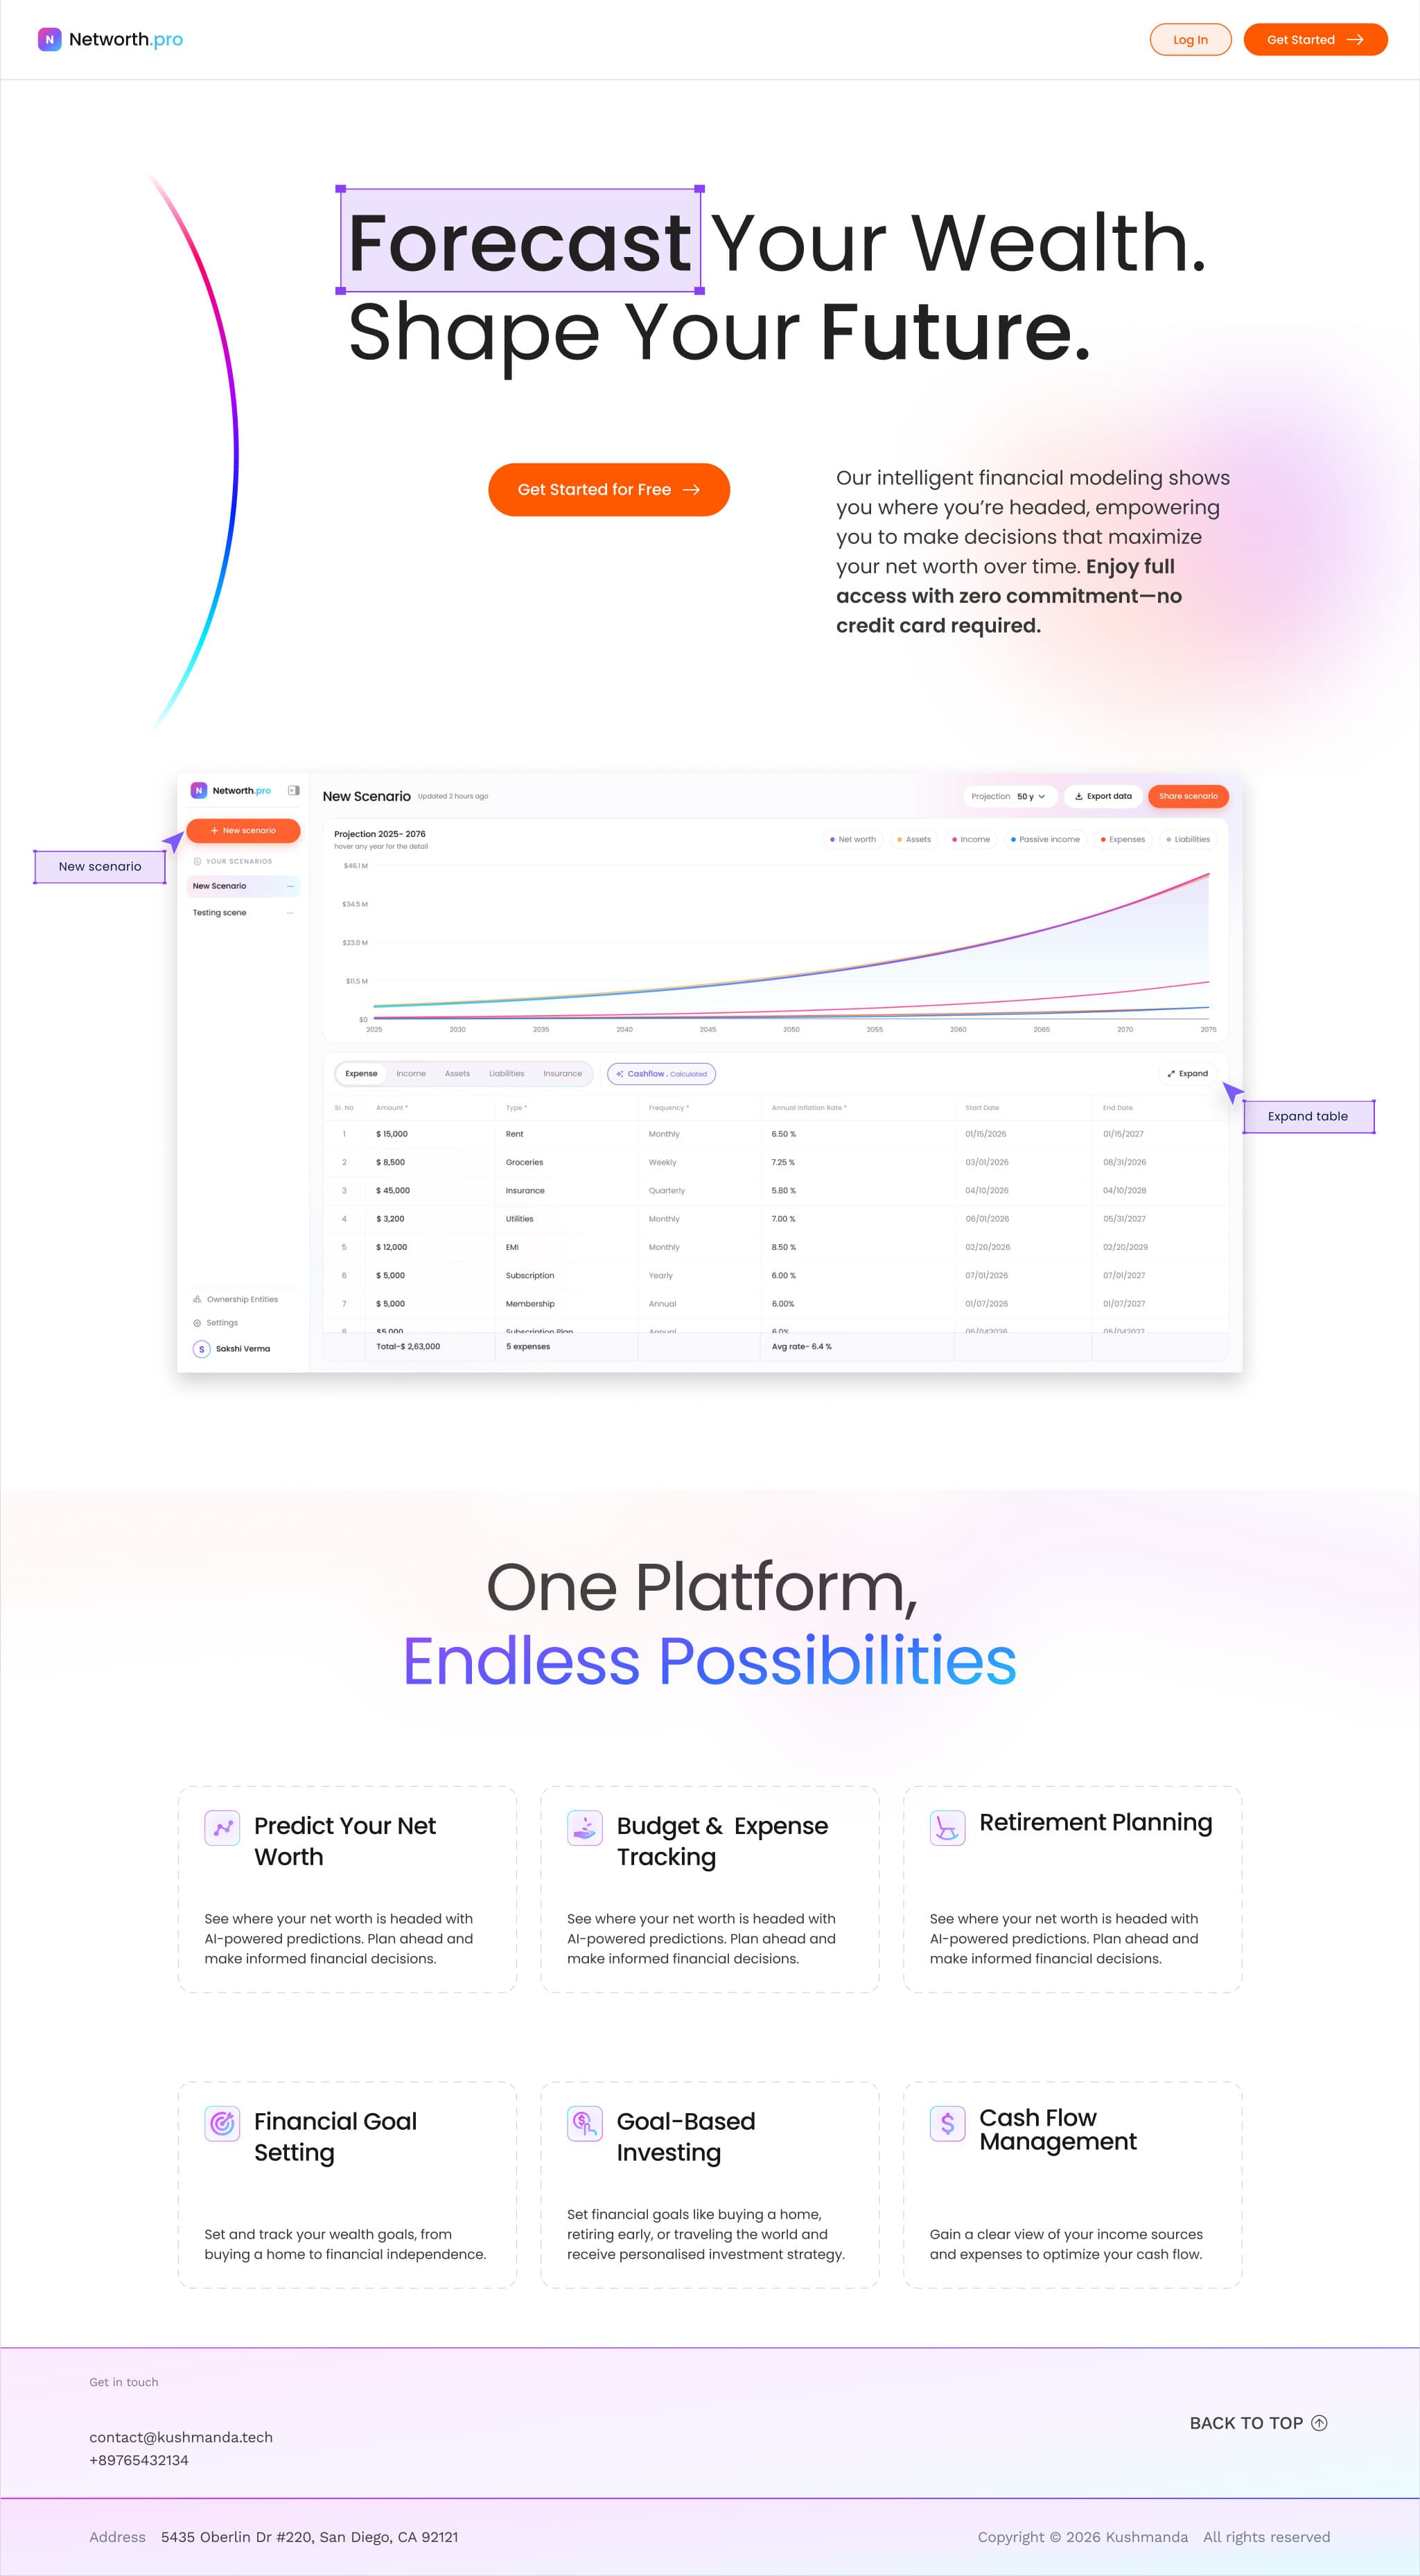
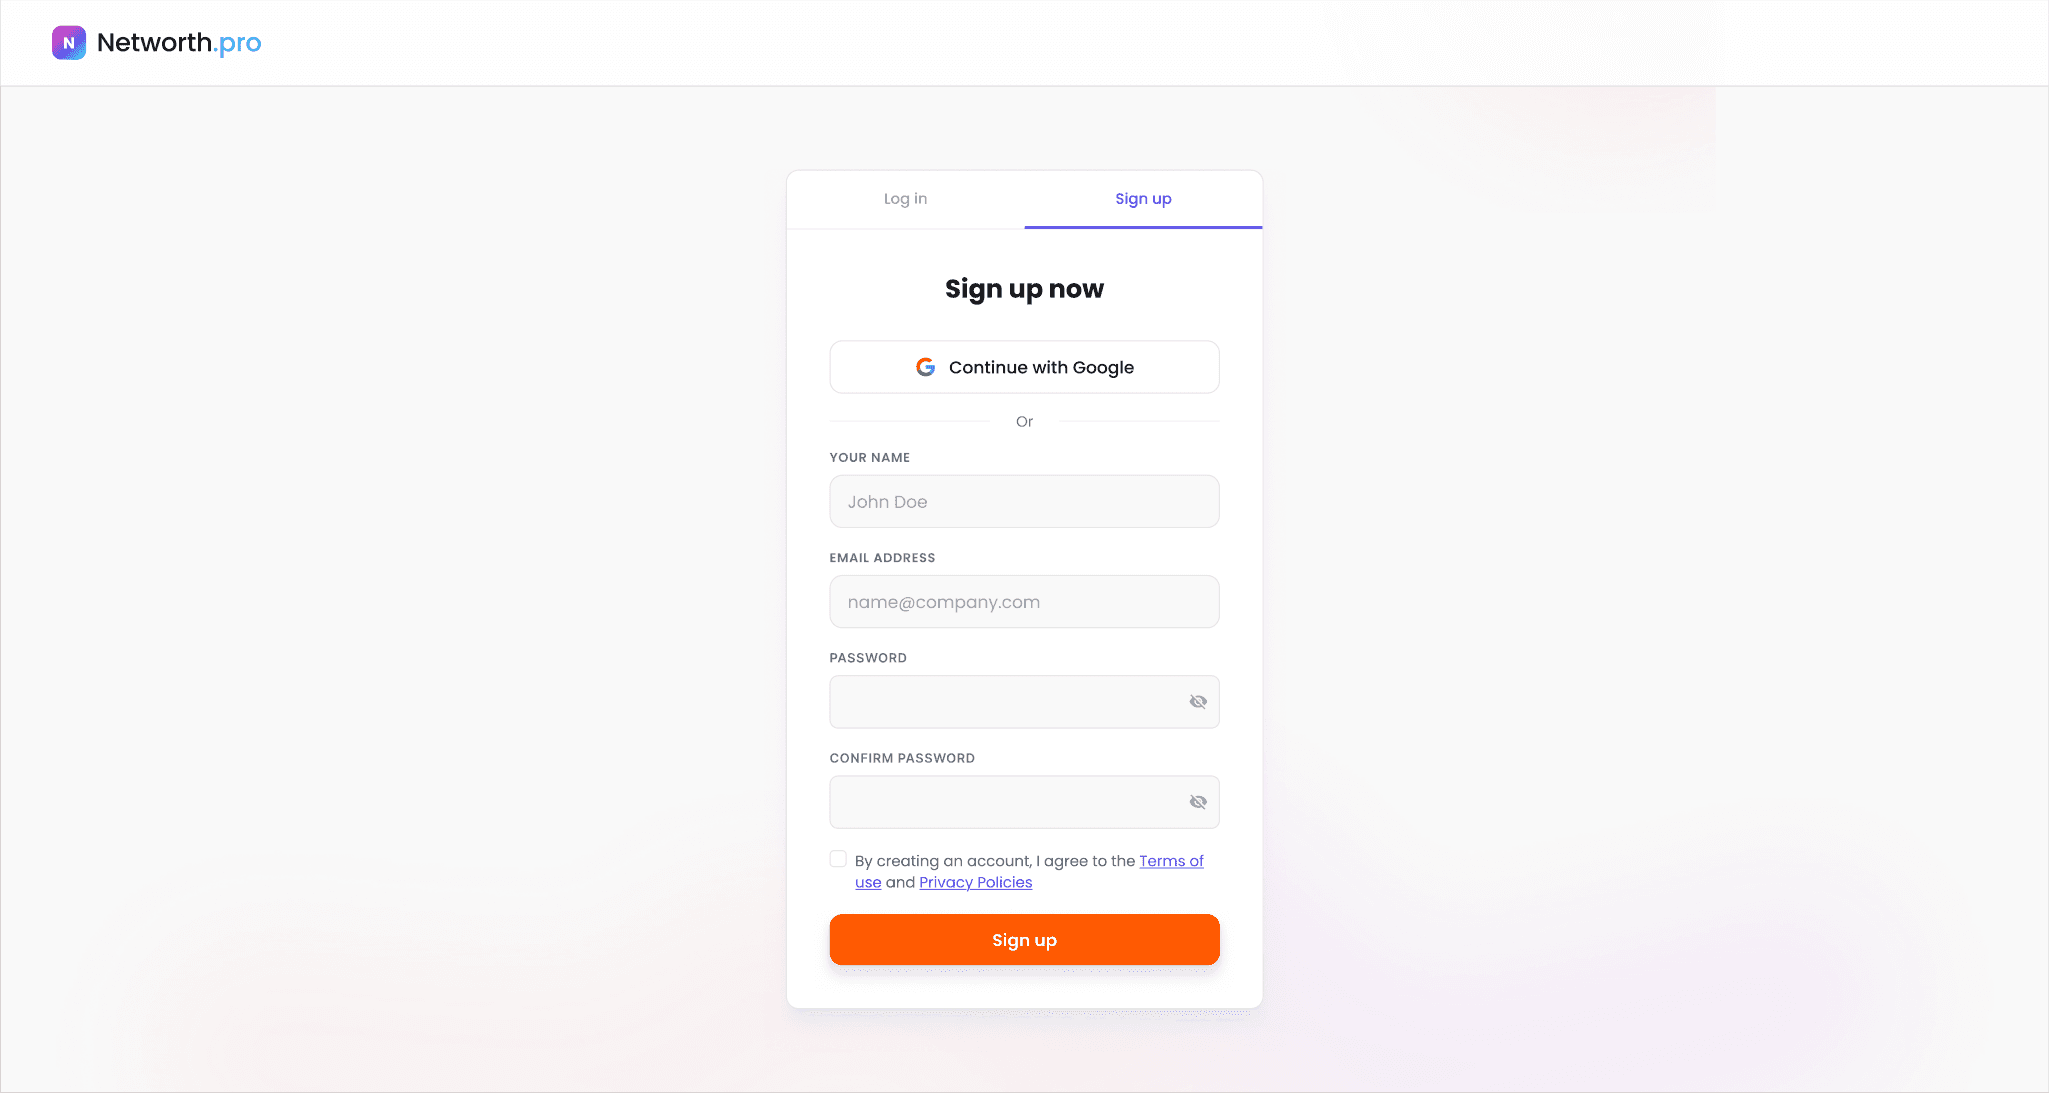
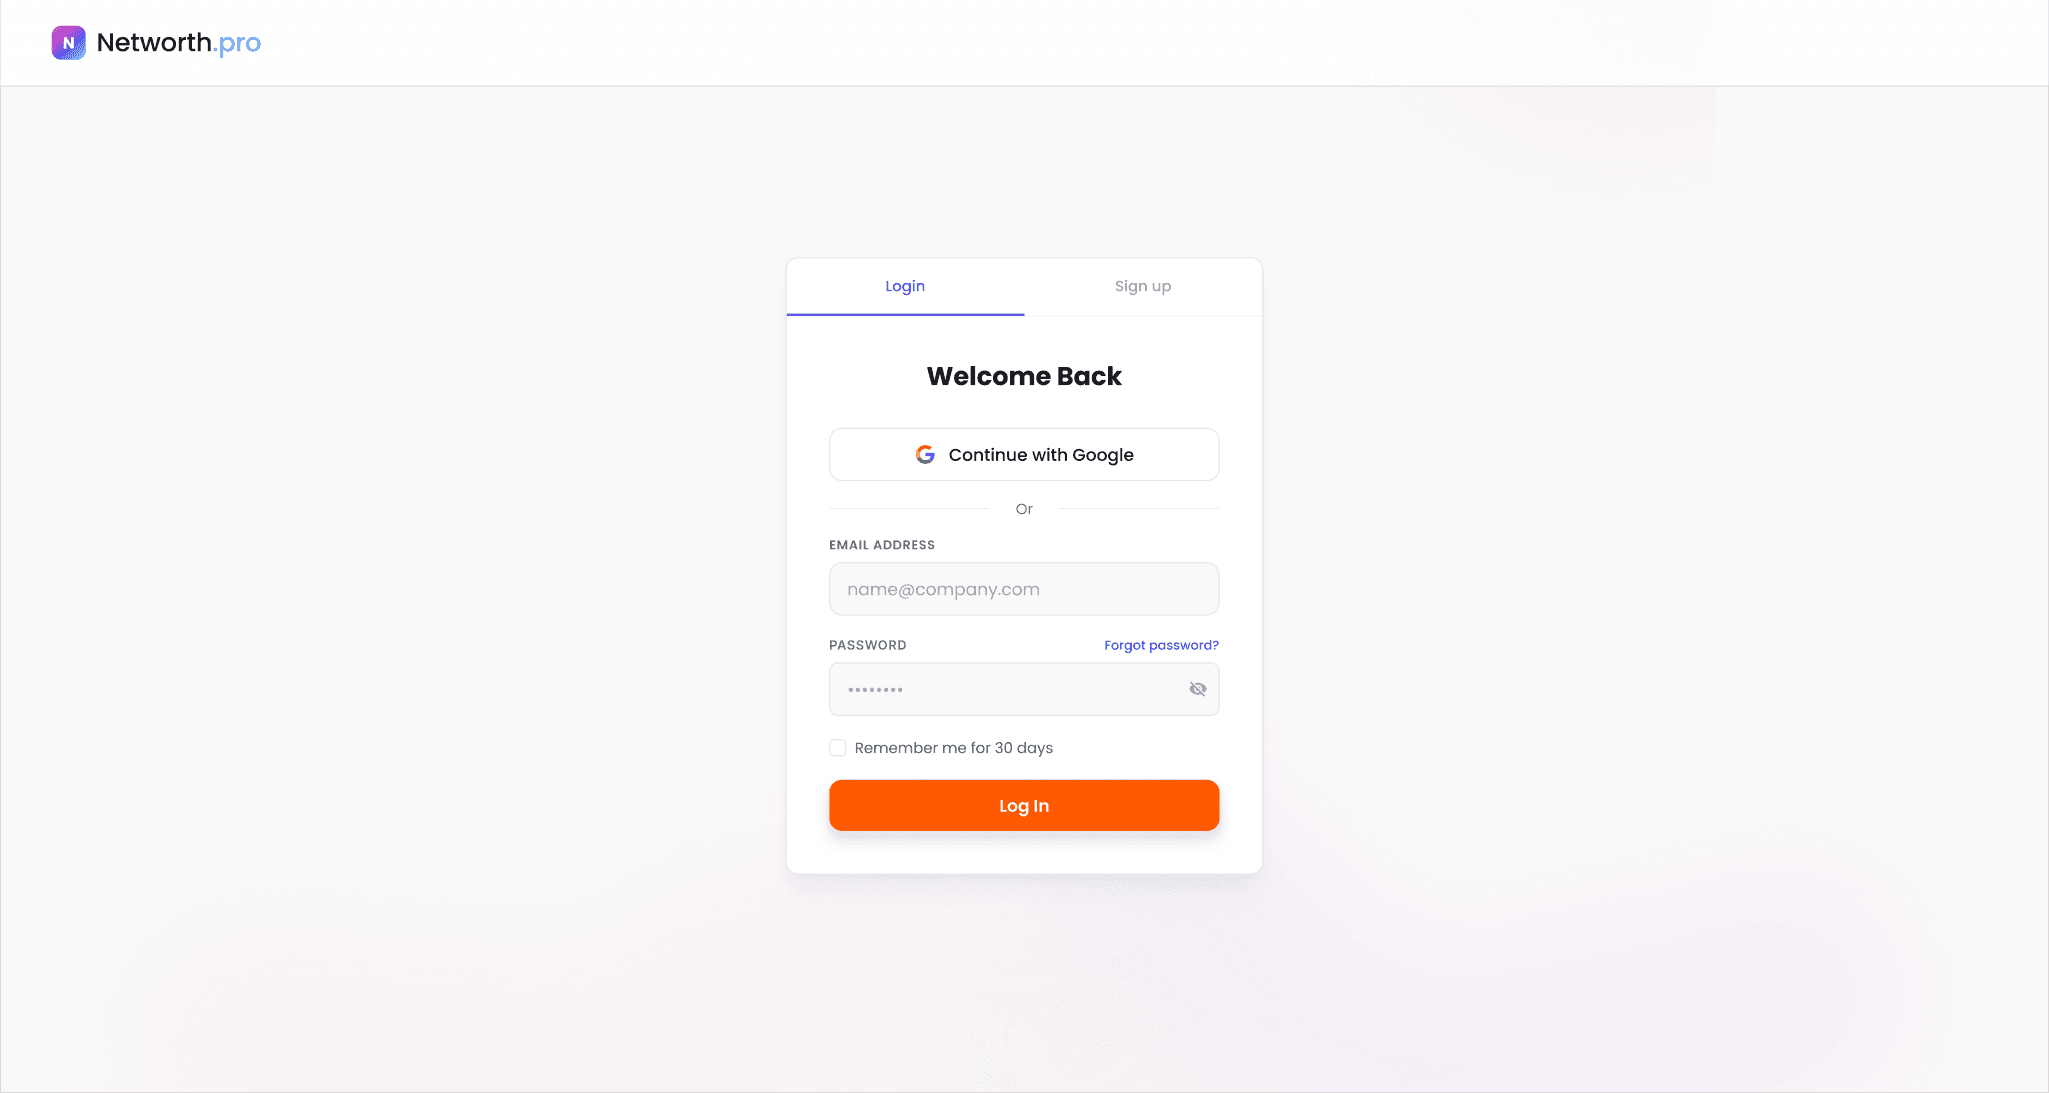
I led the landing page with the forecast itself, putting a real product screen right under the headline so visitors see what they'll get before they sign up. Below it, six feature cards cover the main jobs, from predicting net worth to cash flow management. Sign up and log in reuse the same soft gradient and orange CTA, and both offer Google sign-in.
05 Onboarding
Teaching the workspace in place.
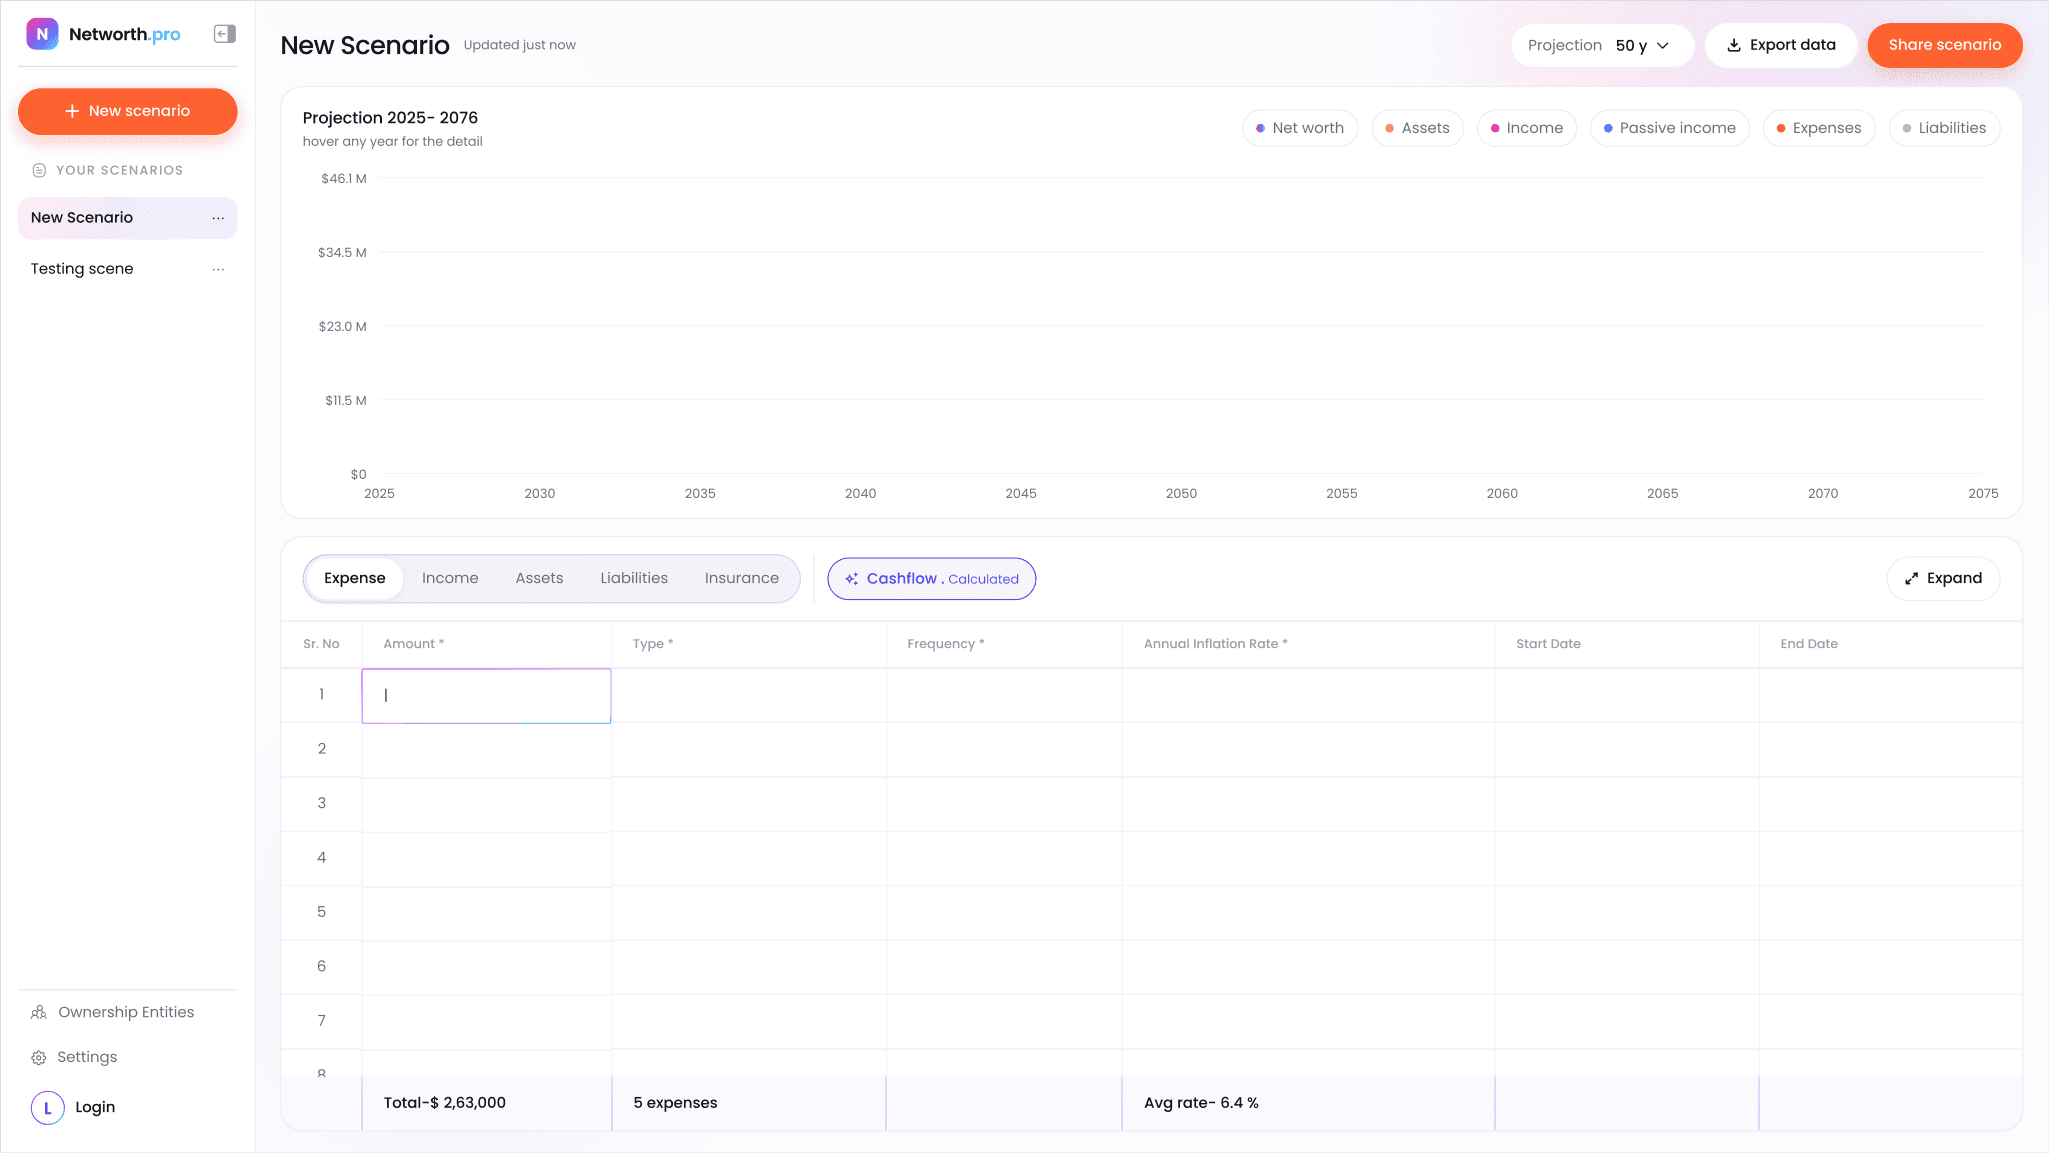
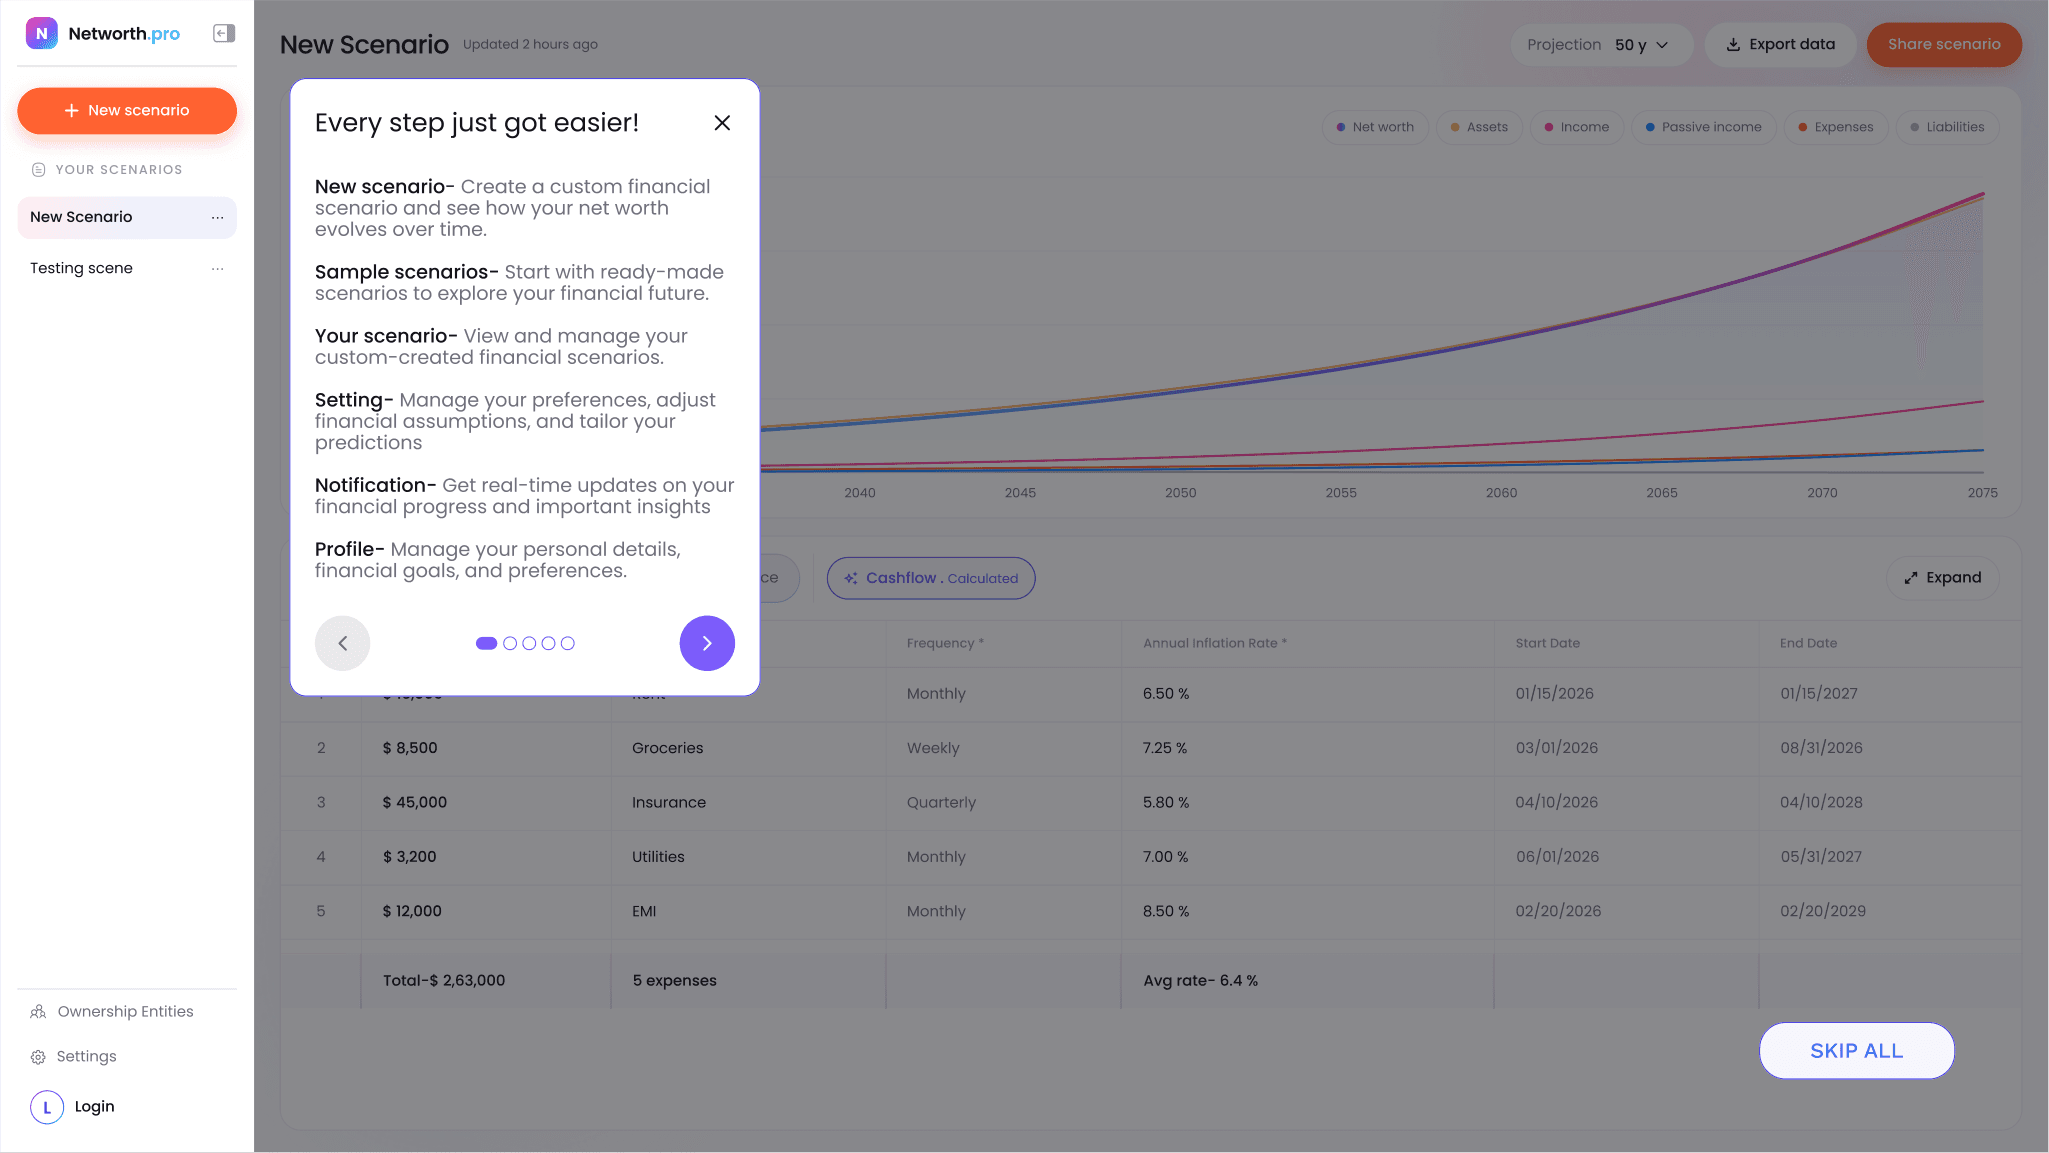
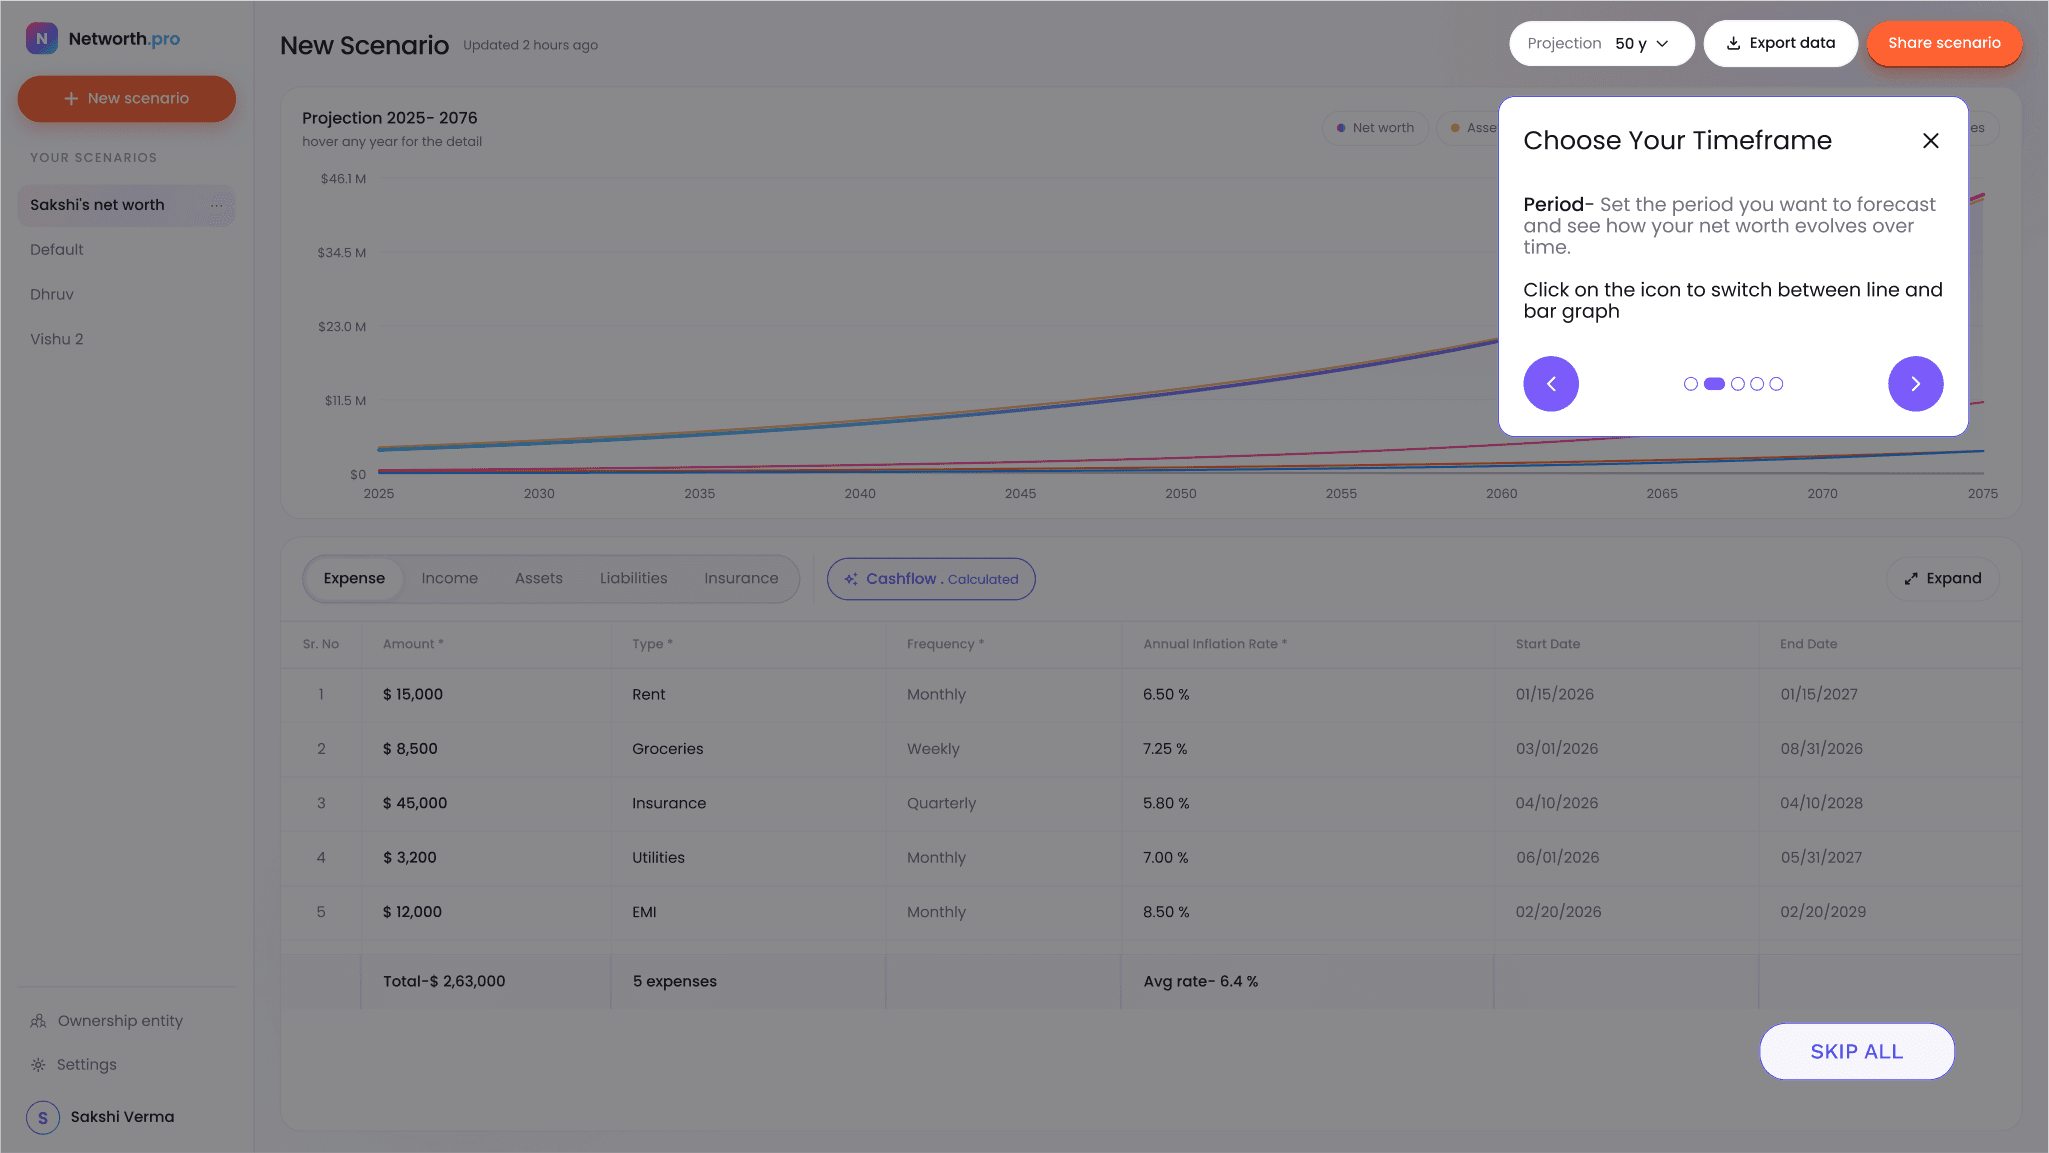
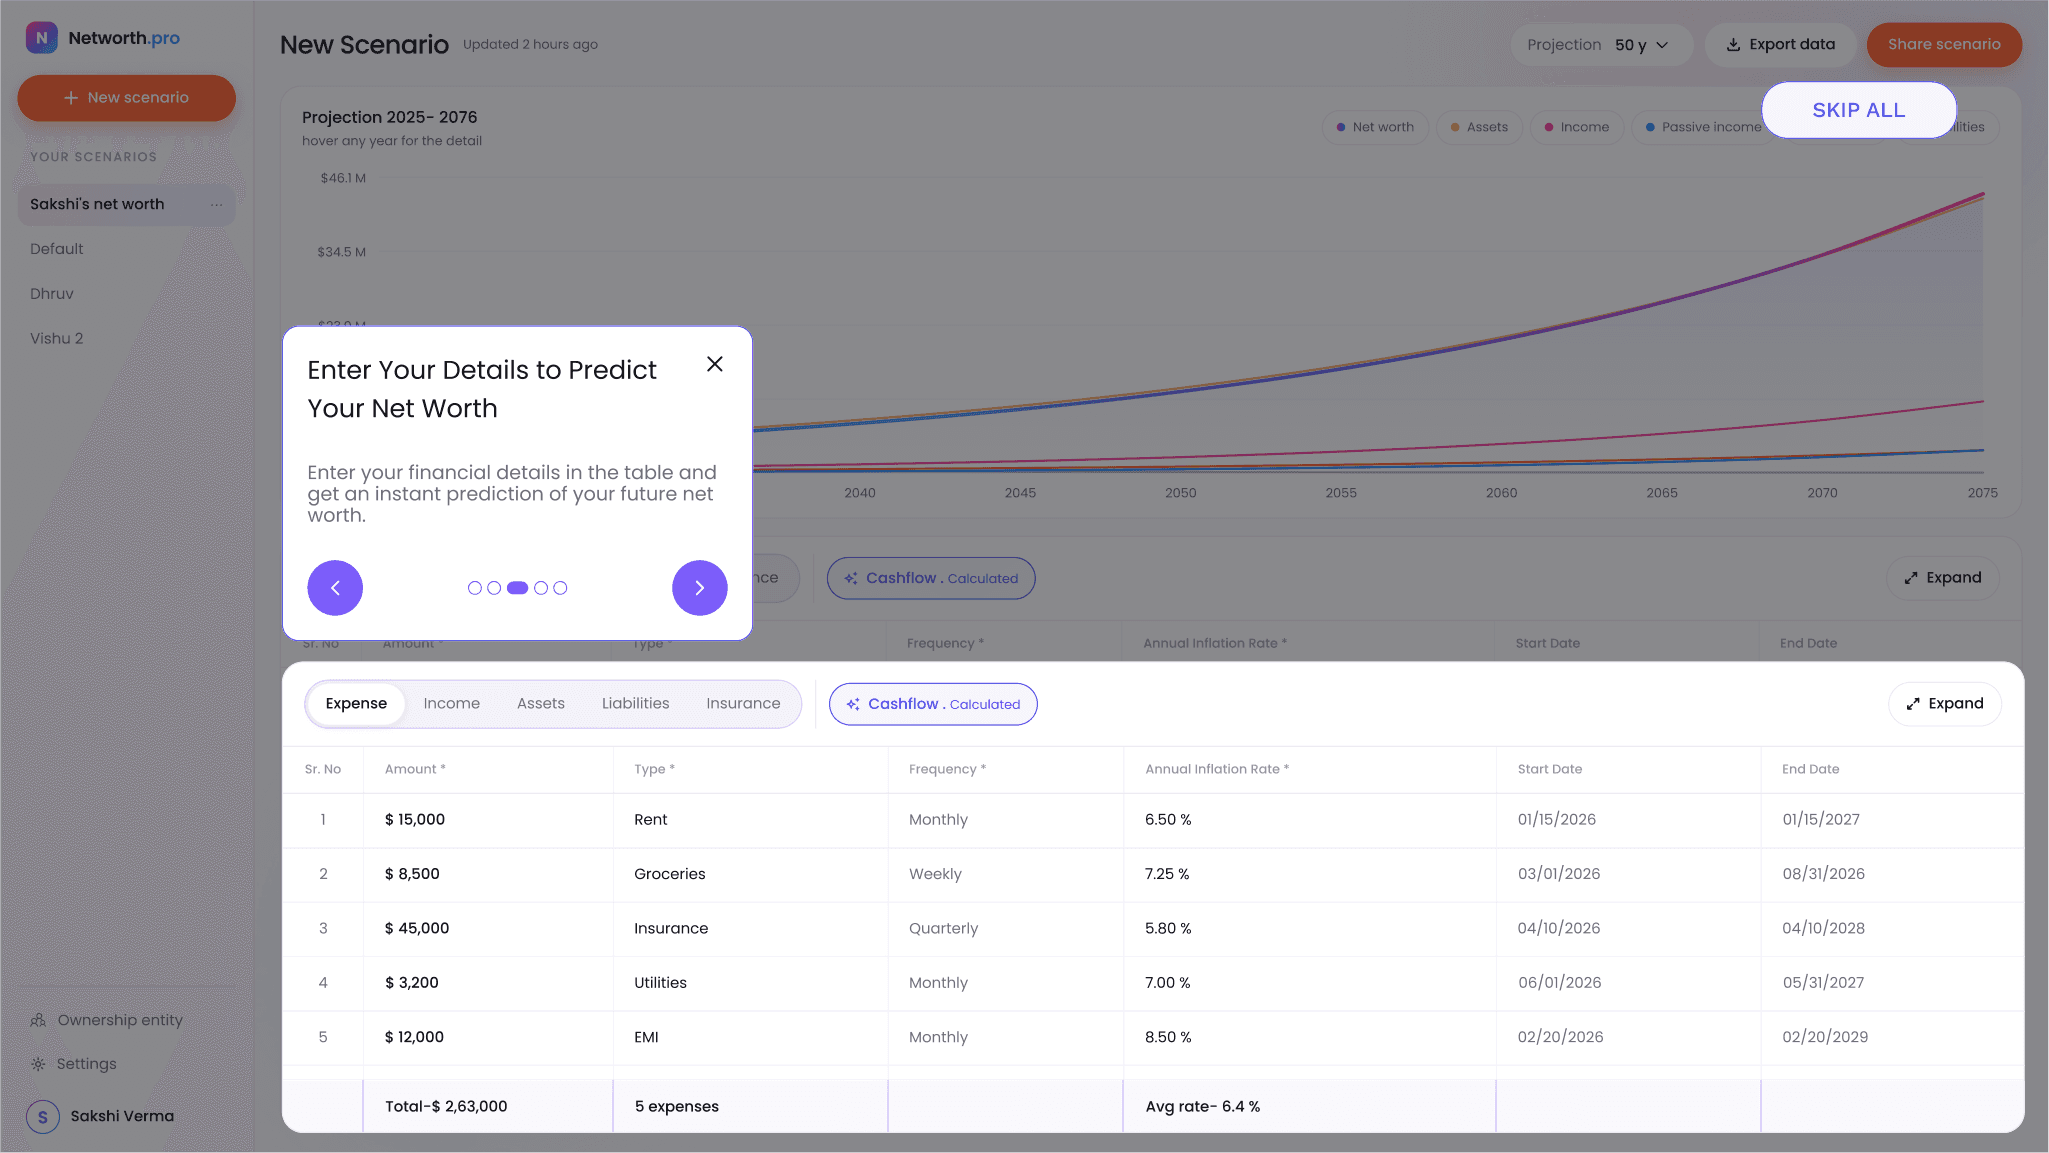
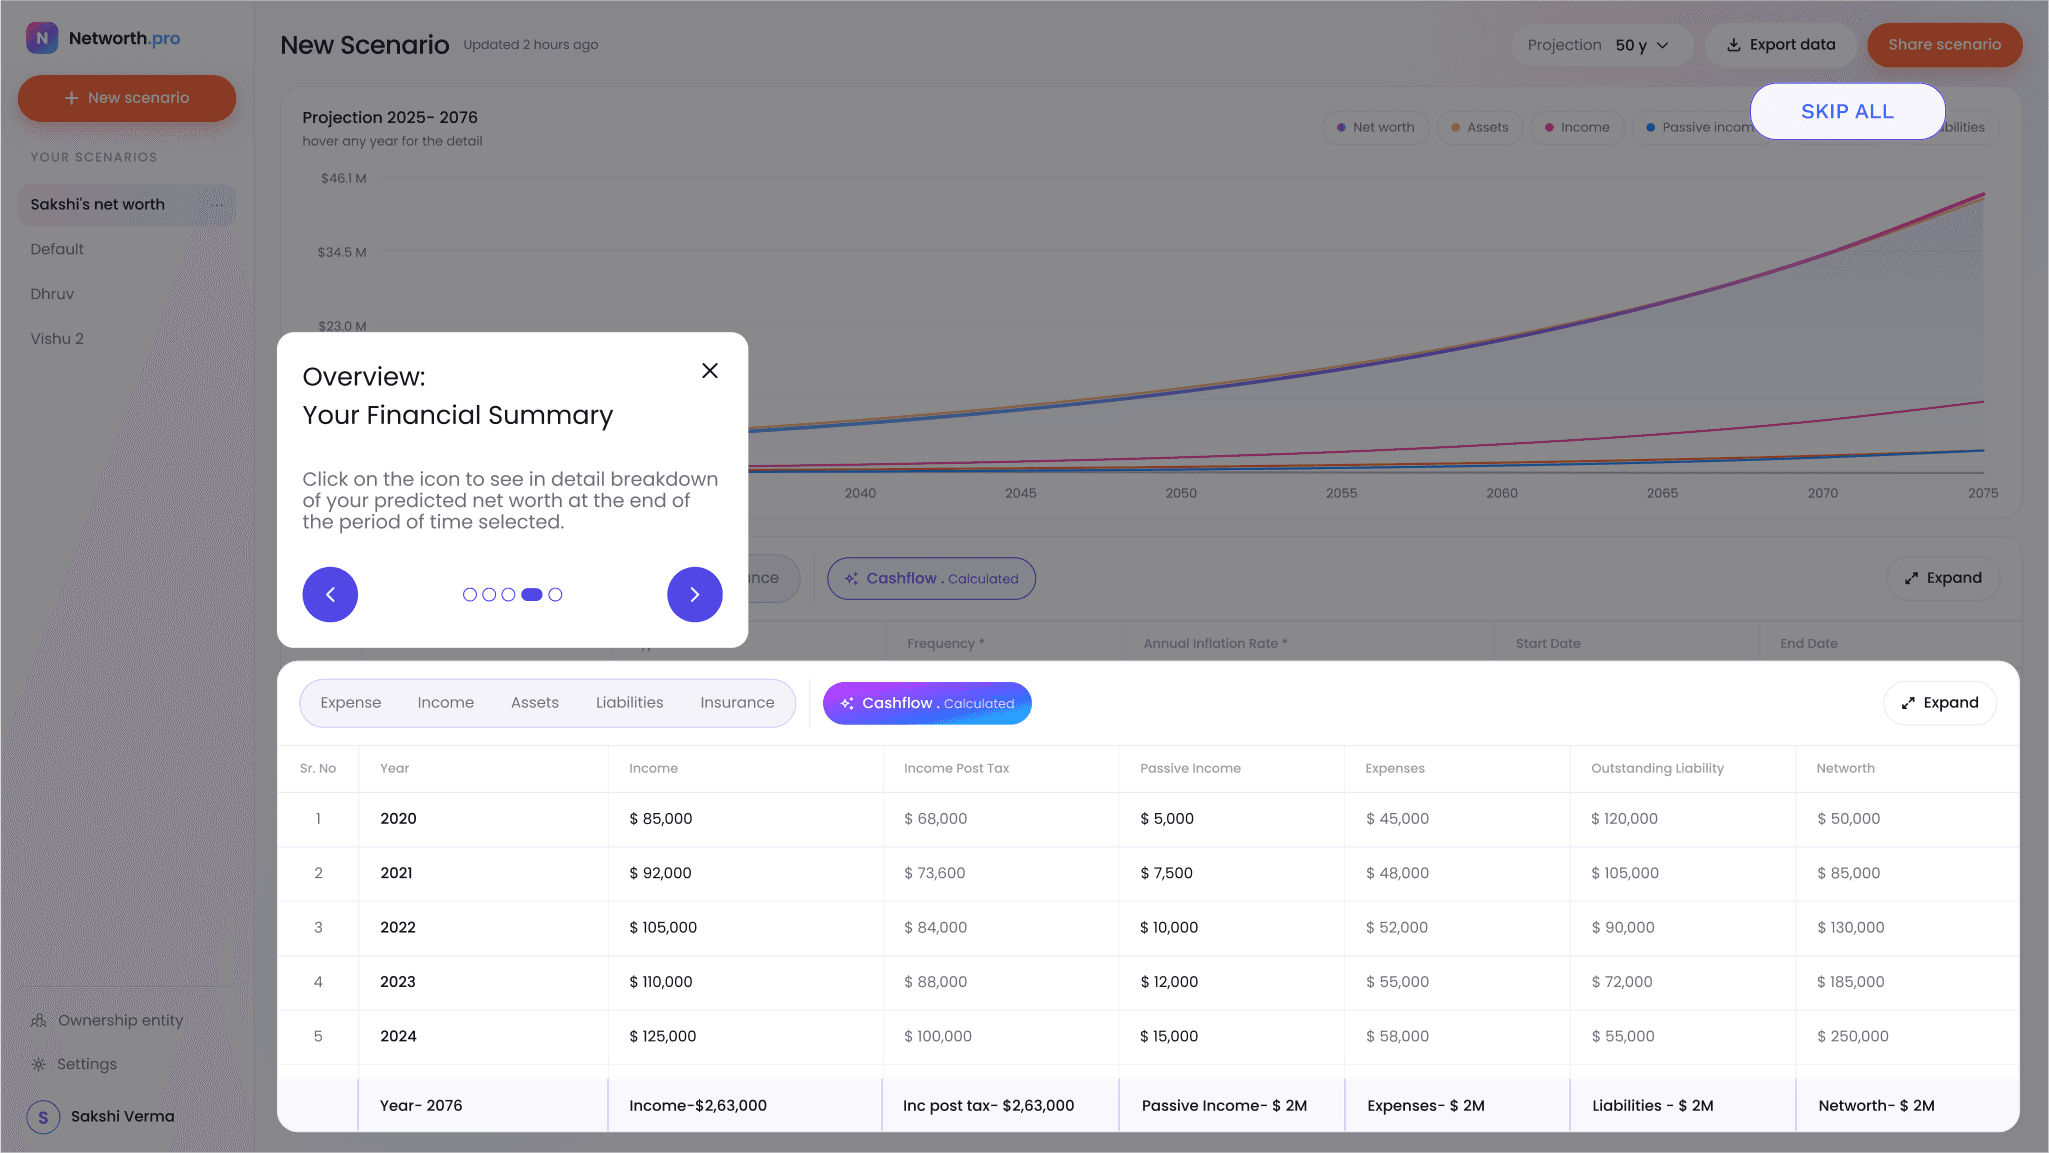
New users land in an empty scenario. Instead of a separate tutorial, I walk them through the real interface with a few coach marks: what each area does, how to set the projection period, where to enter data and how to read the summary. Any step can be skipped.
06 Scenario workspace
Putting inputs and forecast on one screen.
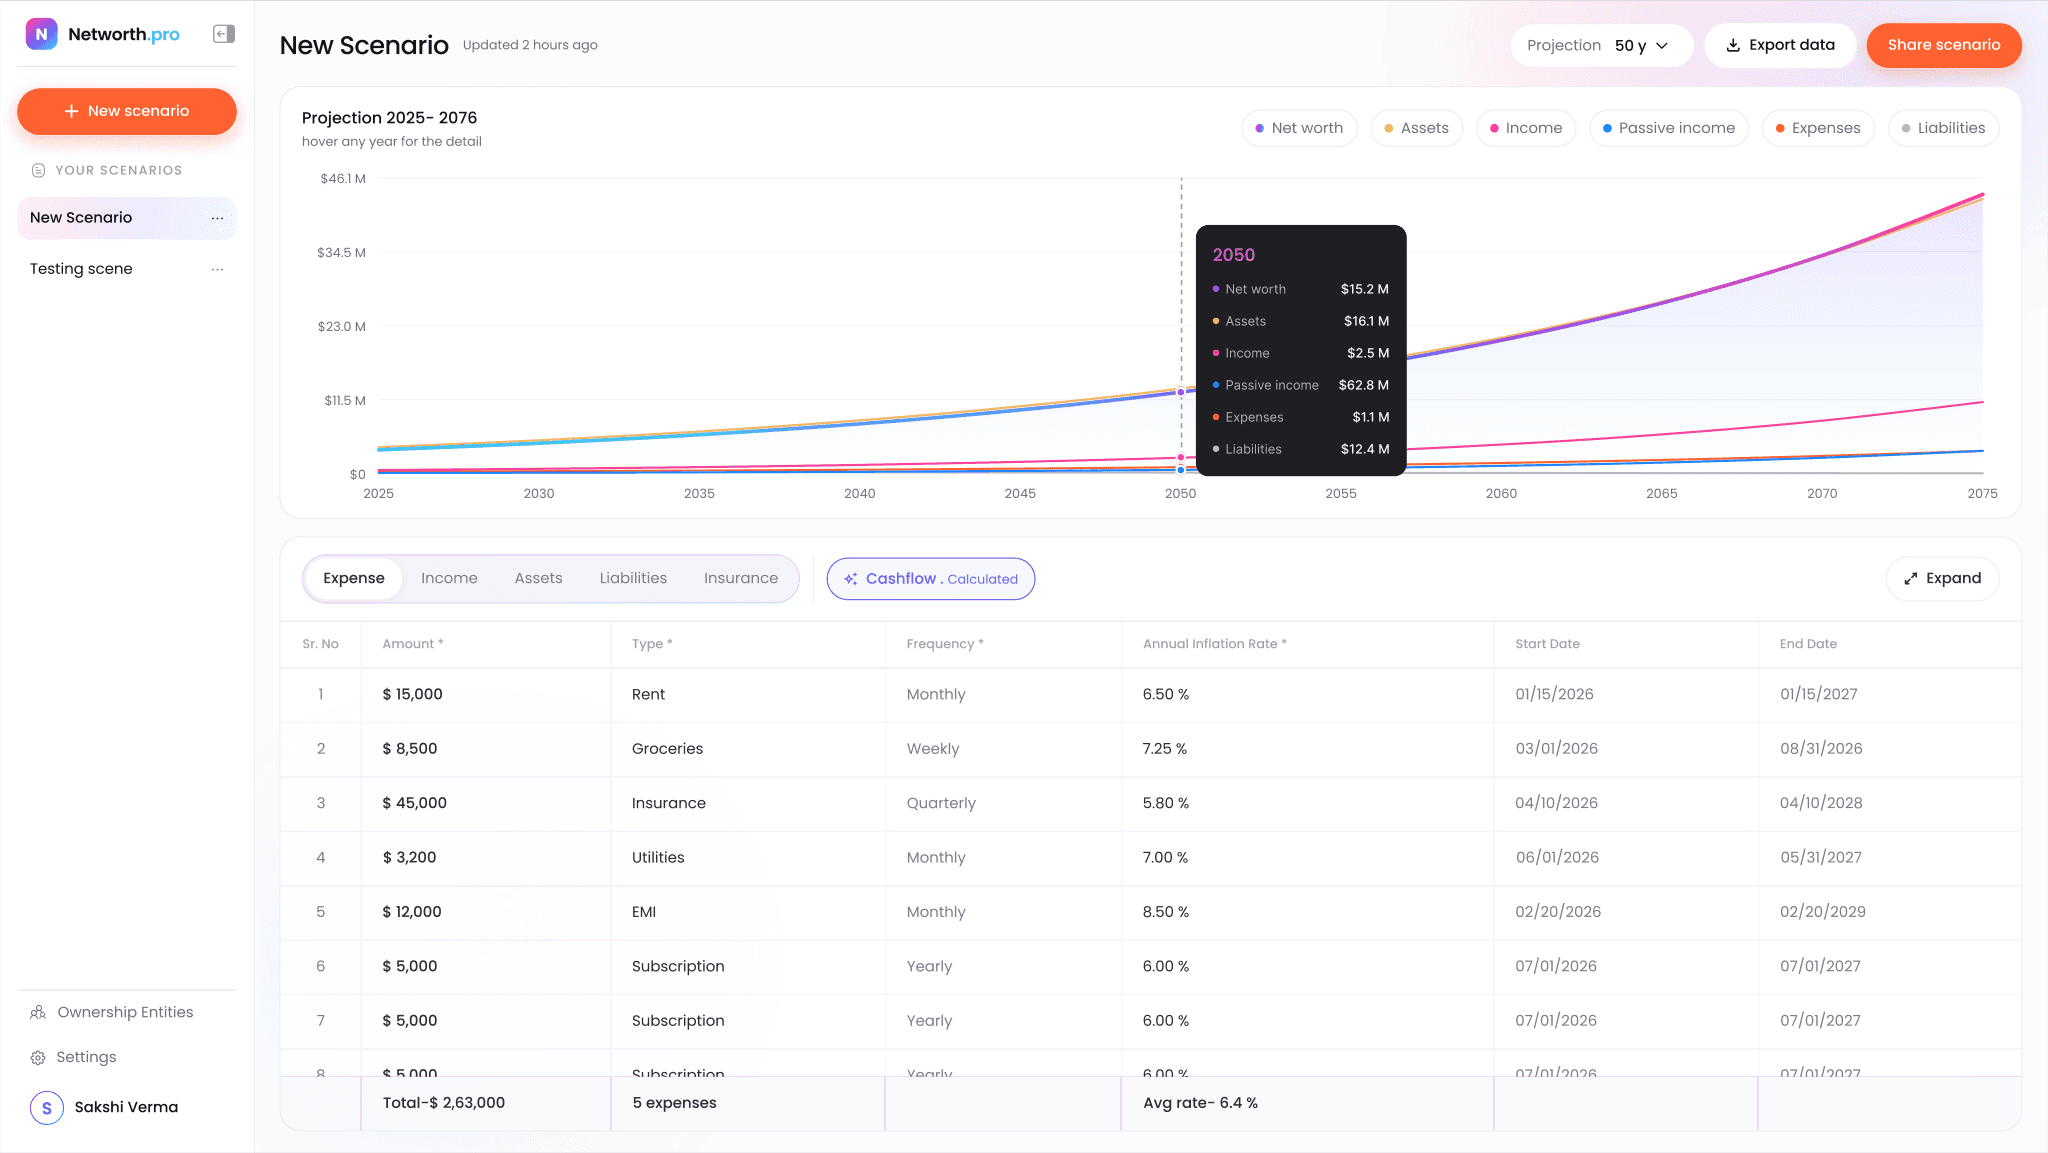
Change a number in the table, and the curve redraws above it.
01 / 06Every scenario sits in the sidebar, with New scenario always one click away. Each row has its own menu, so you don't have to open a scenario to manage it.
02 / 06The projection period stretches the forecast however far ahead you want to look. Export and Share sit next to it at the top of the page.
03 / 06Legend chips switch each line on or off. Each chip keeps its line colour so the chart and legend read as one.
04 / 06The chart shows the long-term trend. Hovering any year opens a breakdown of every line for that year, without leaving the view.
05 / 06Expense, Income, Assets, Liabilities and Insurance each get their own table under a single tab group. Required columns are marked, and a totals row stays pinned at the bottom.
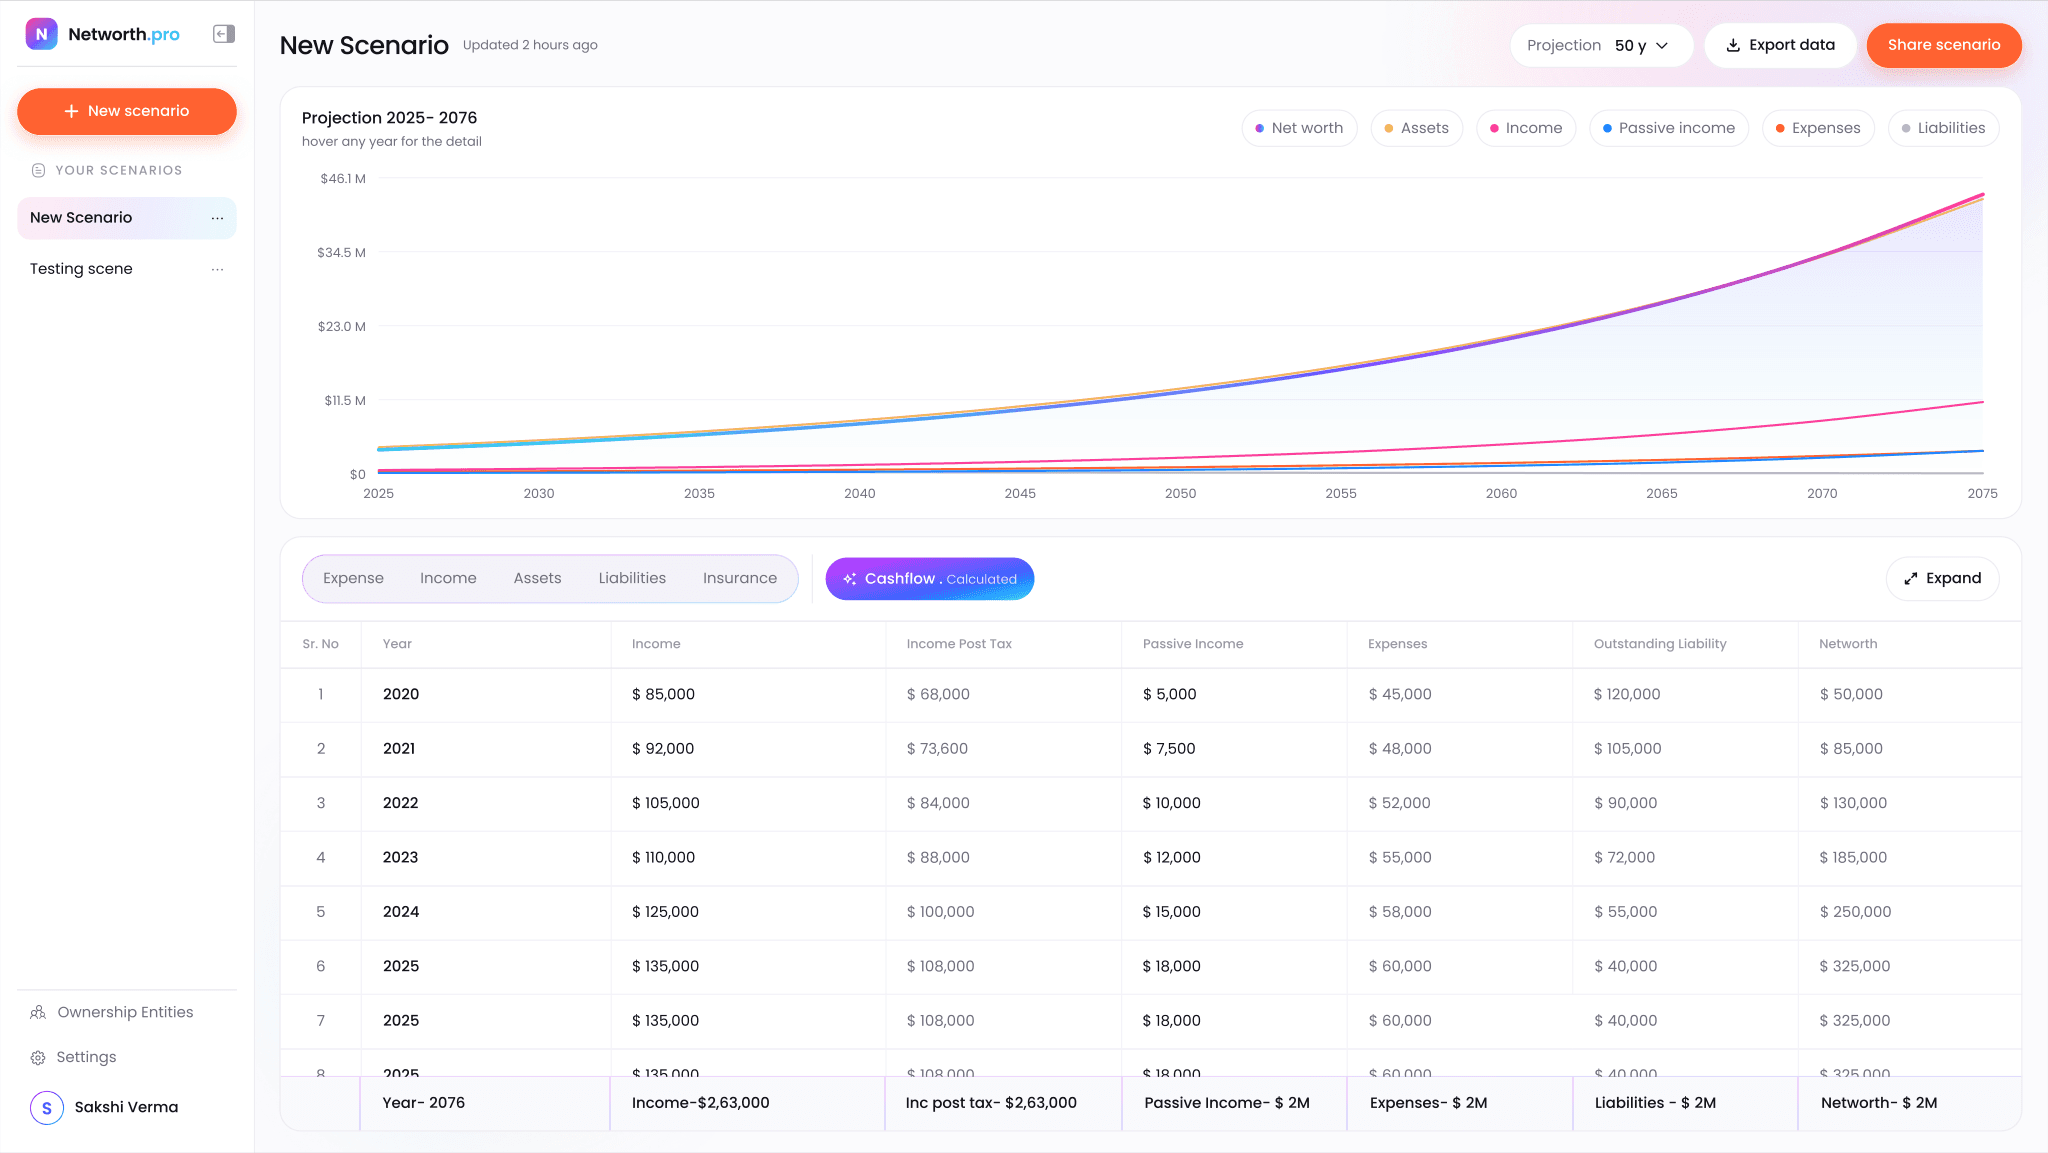
06 / 06Cashflow isn't typed in; it's calculated from the tables. A gradient toggle marks it as derived and opens a year-by-year cashflow view.
07 Managing scenarios
Making what-ifs feel safe.
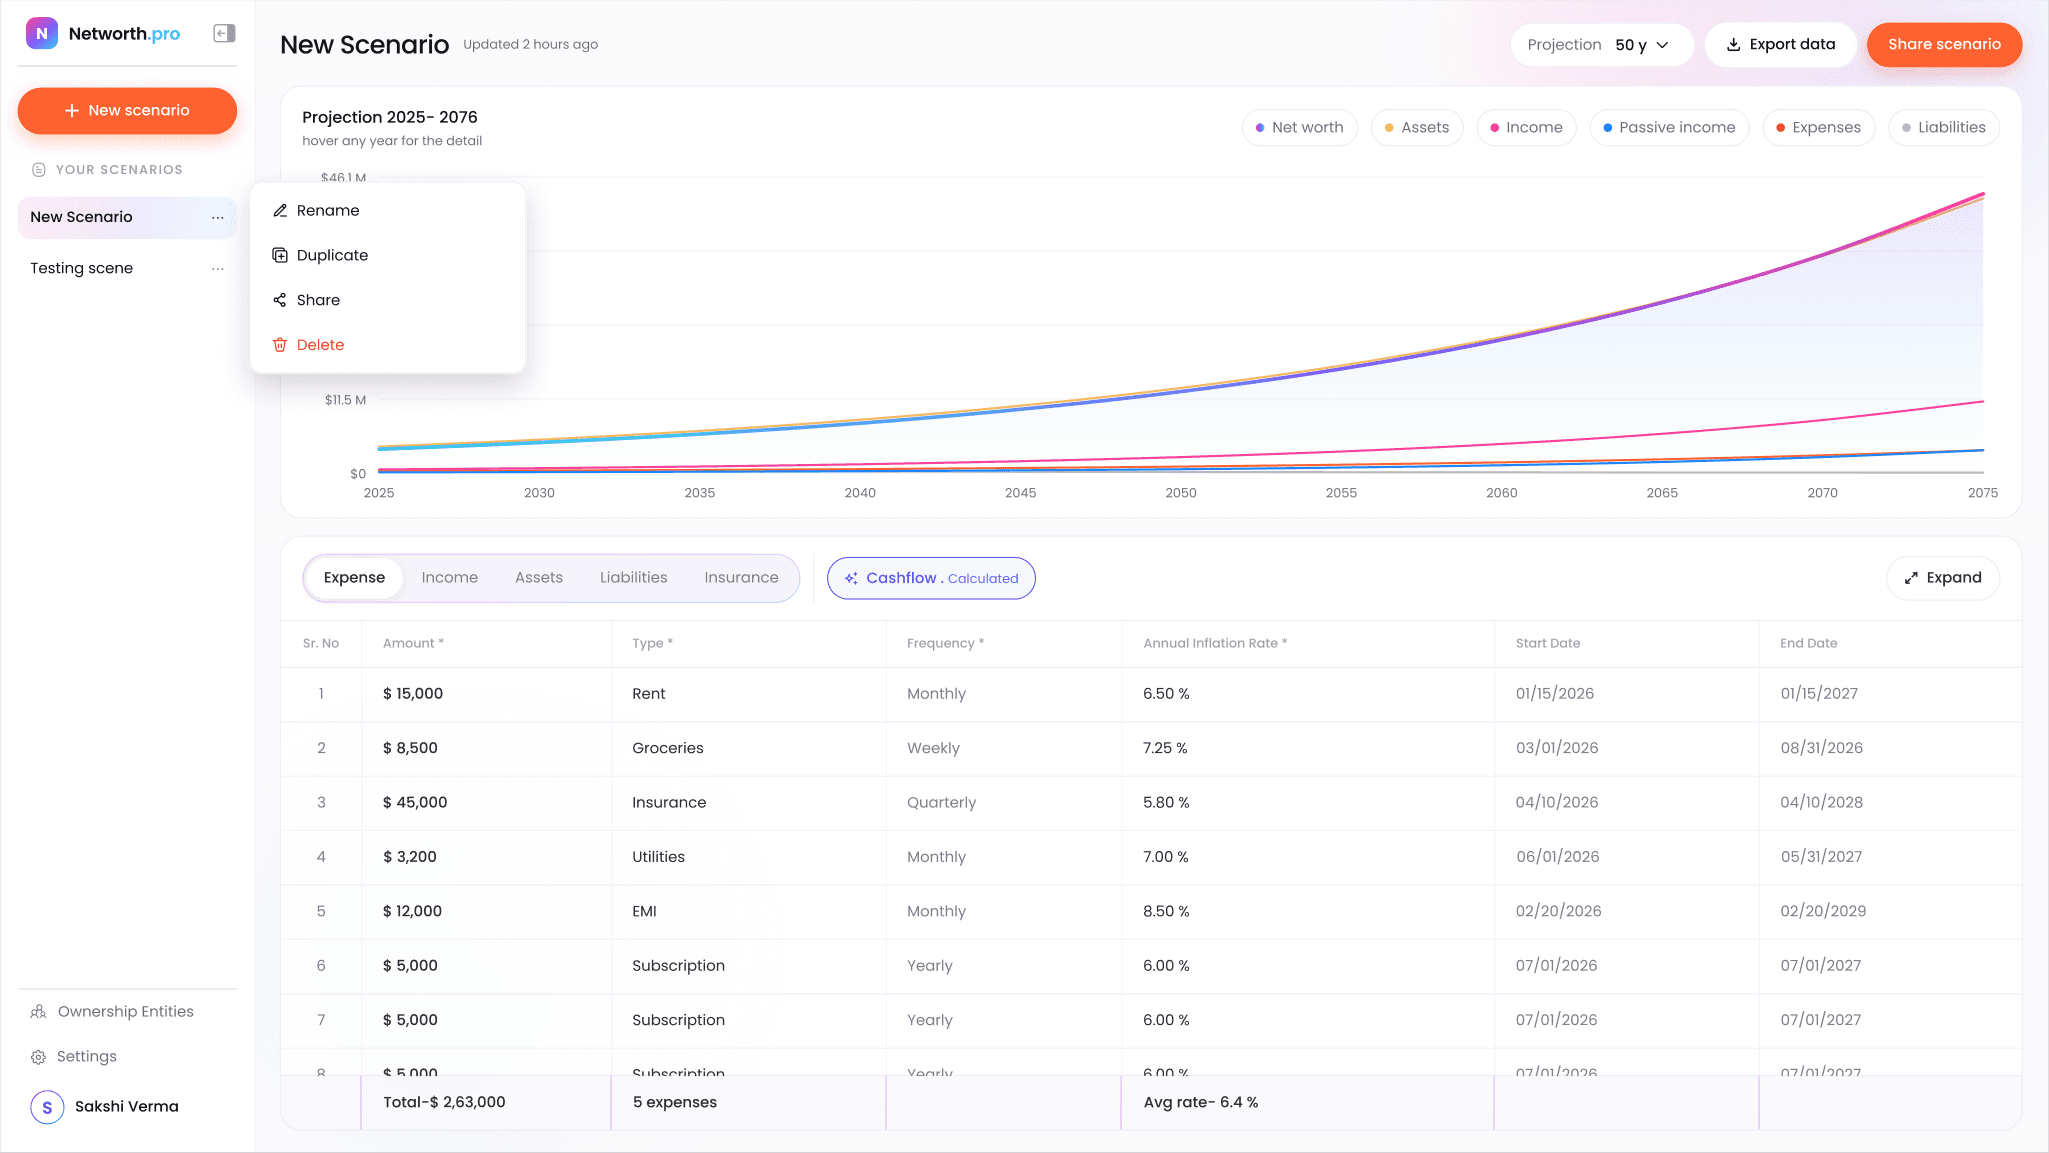
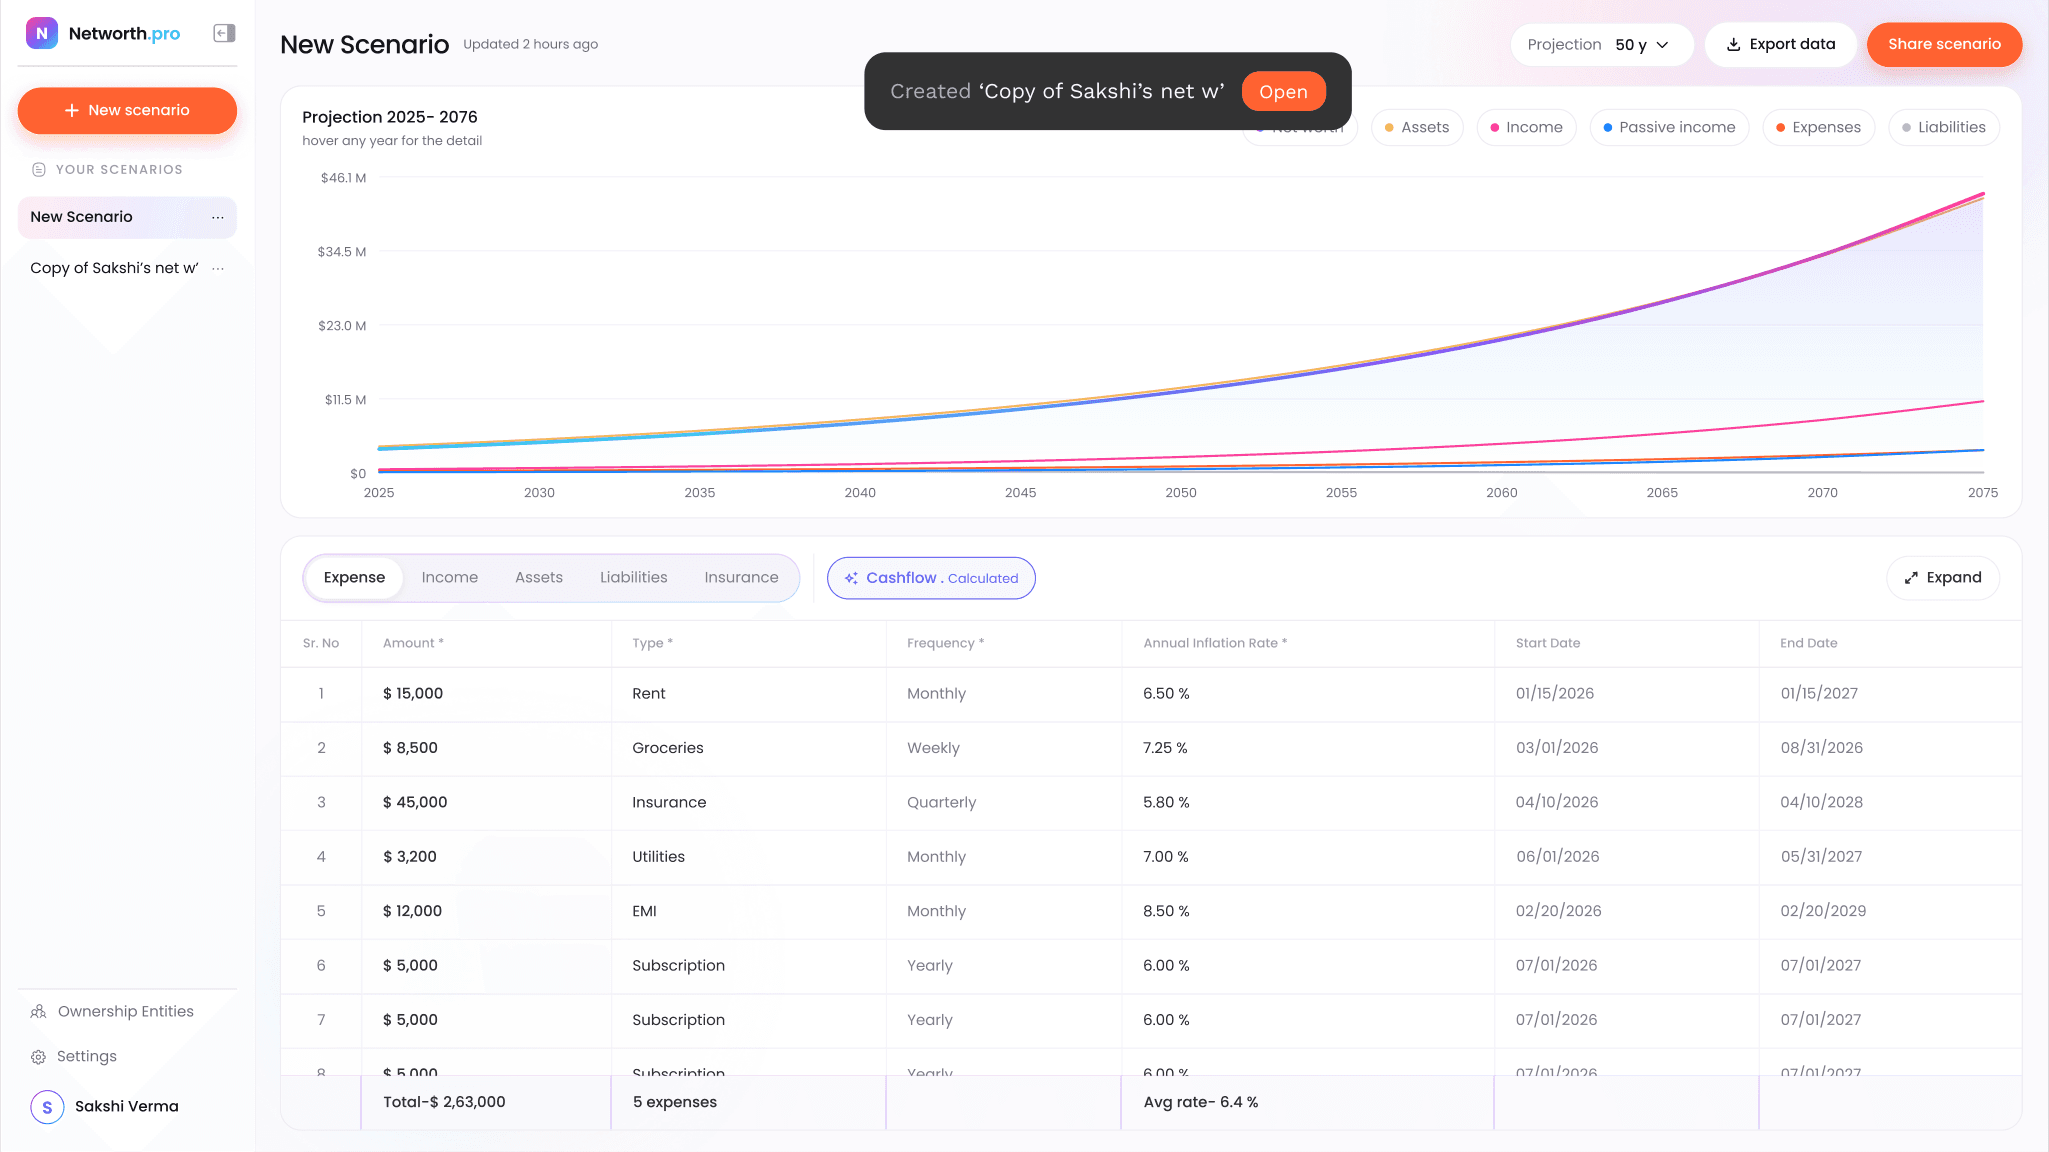
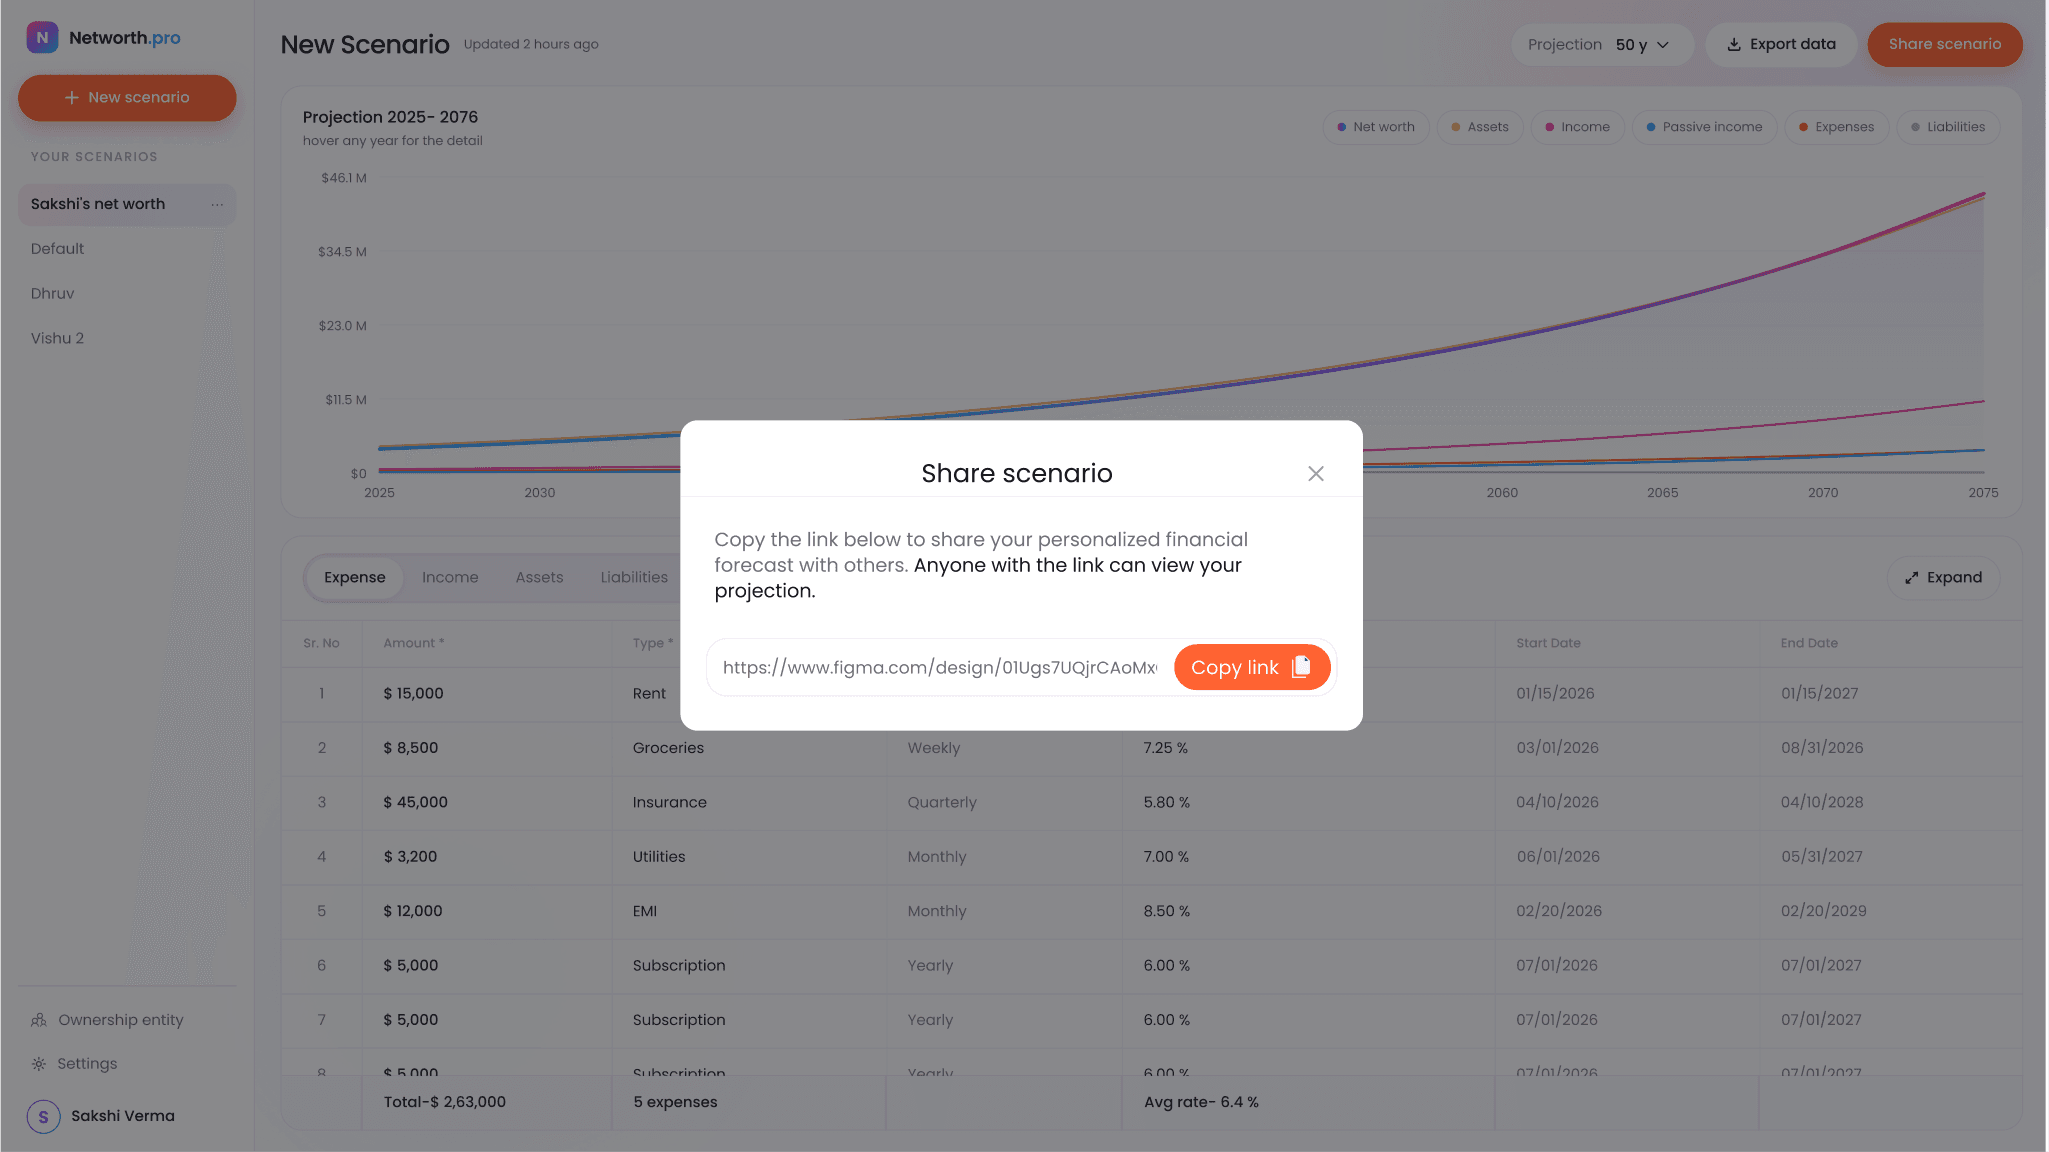
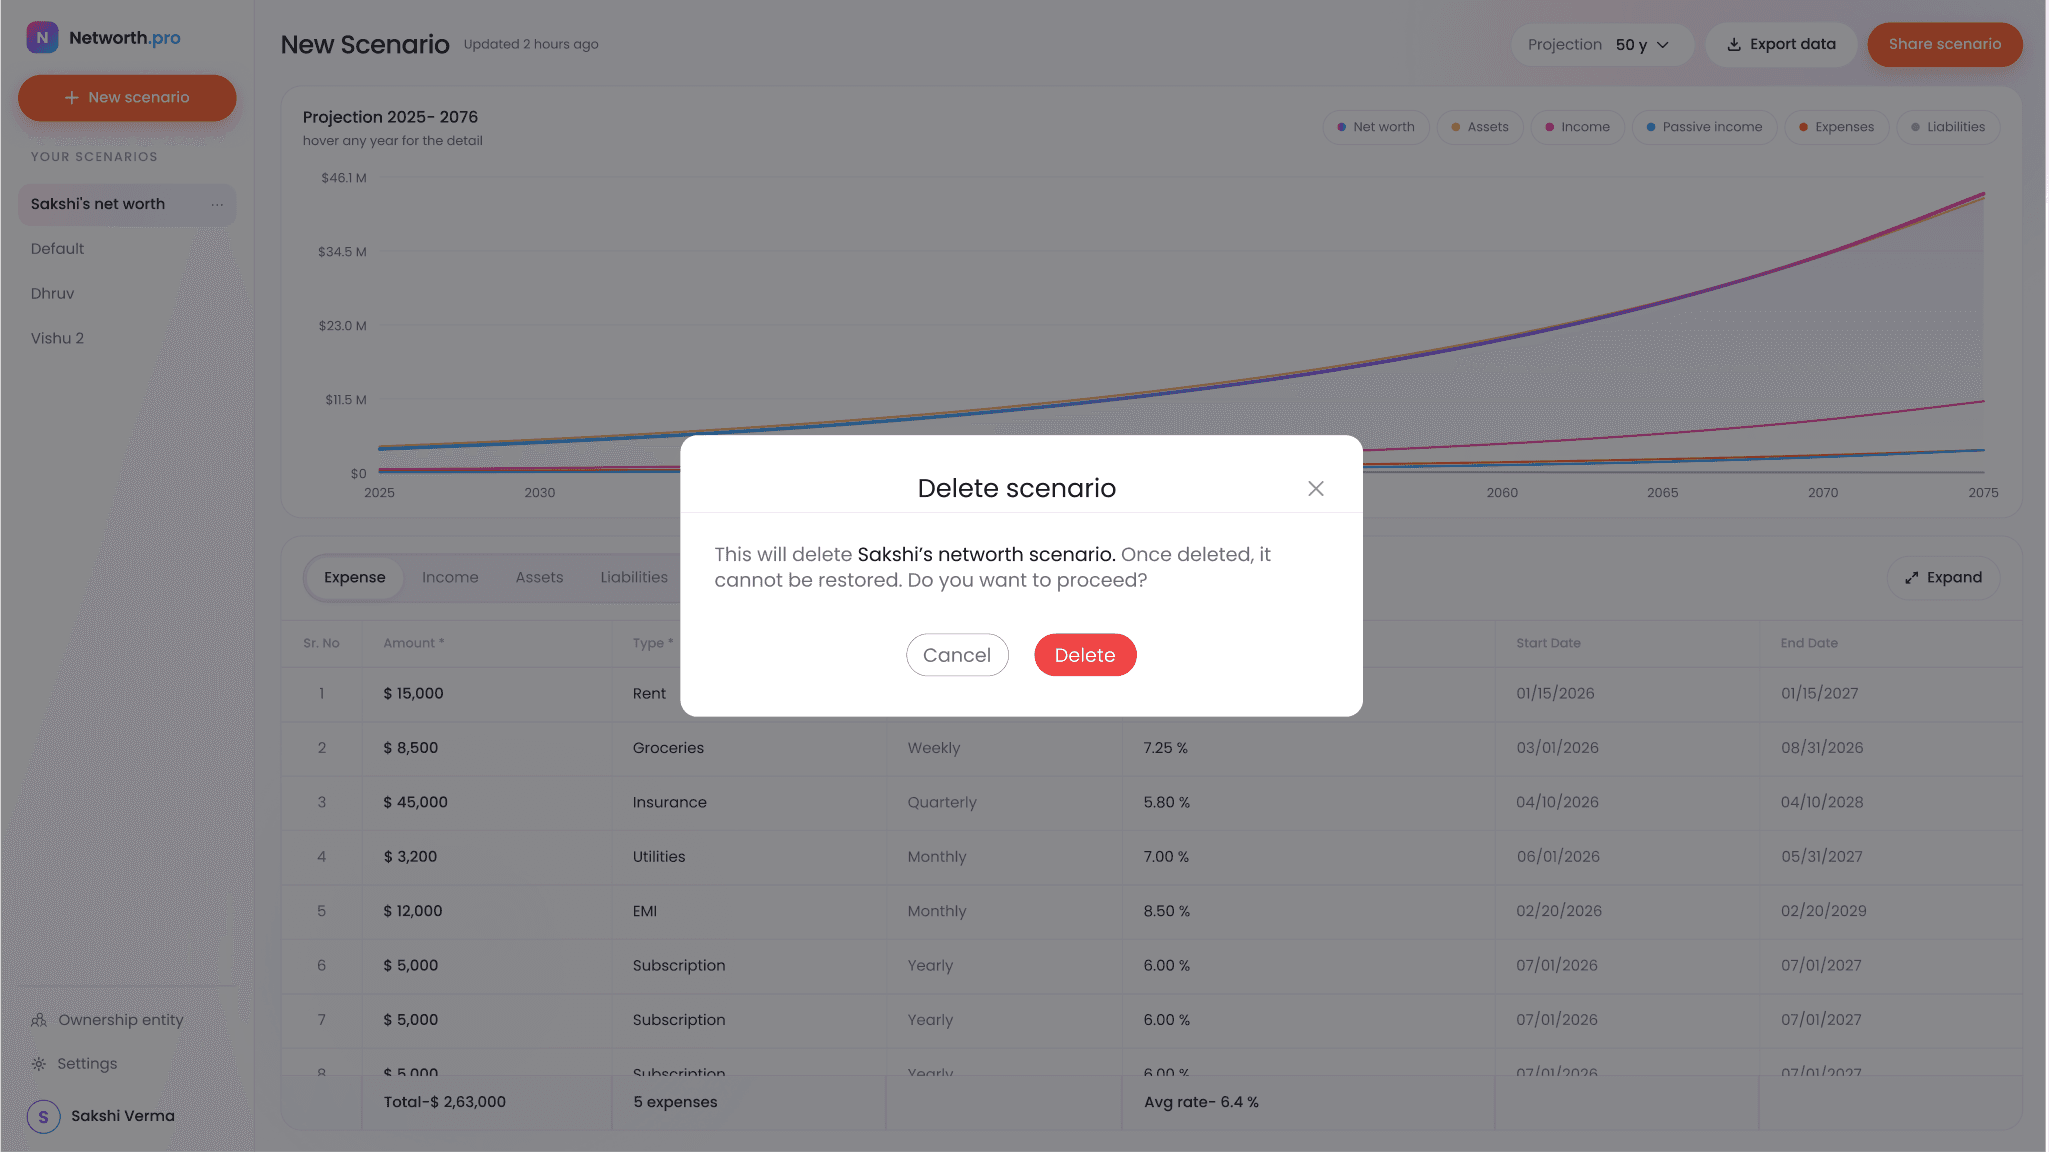
Comparing plans only works if managing scenarios is effortless, so I put every action in the row's menu and gave each one immediate, reversible feedback.
01Each scenario row has a menu with Rename, Duplicate, Share and Delete, so you can manage a scenario straight from the sidebar.
02Duplicating creates a copy instantly and confirms it with a toast, so trying a variation never puts the original at risk.
03Sharing gives a read-only link to the forecast, which is useful for showing a partner or an advisor.
04Delete is the only destructive action, so it names the scenario and asks for confirmation, with the Delete button in red.
08 Ownership entities
Breaking trusts and LLCs into steps.
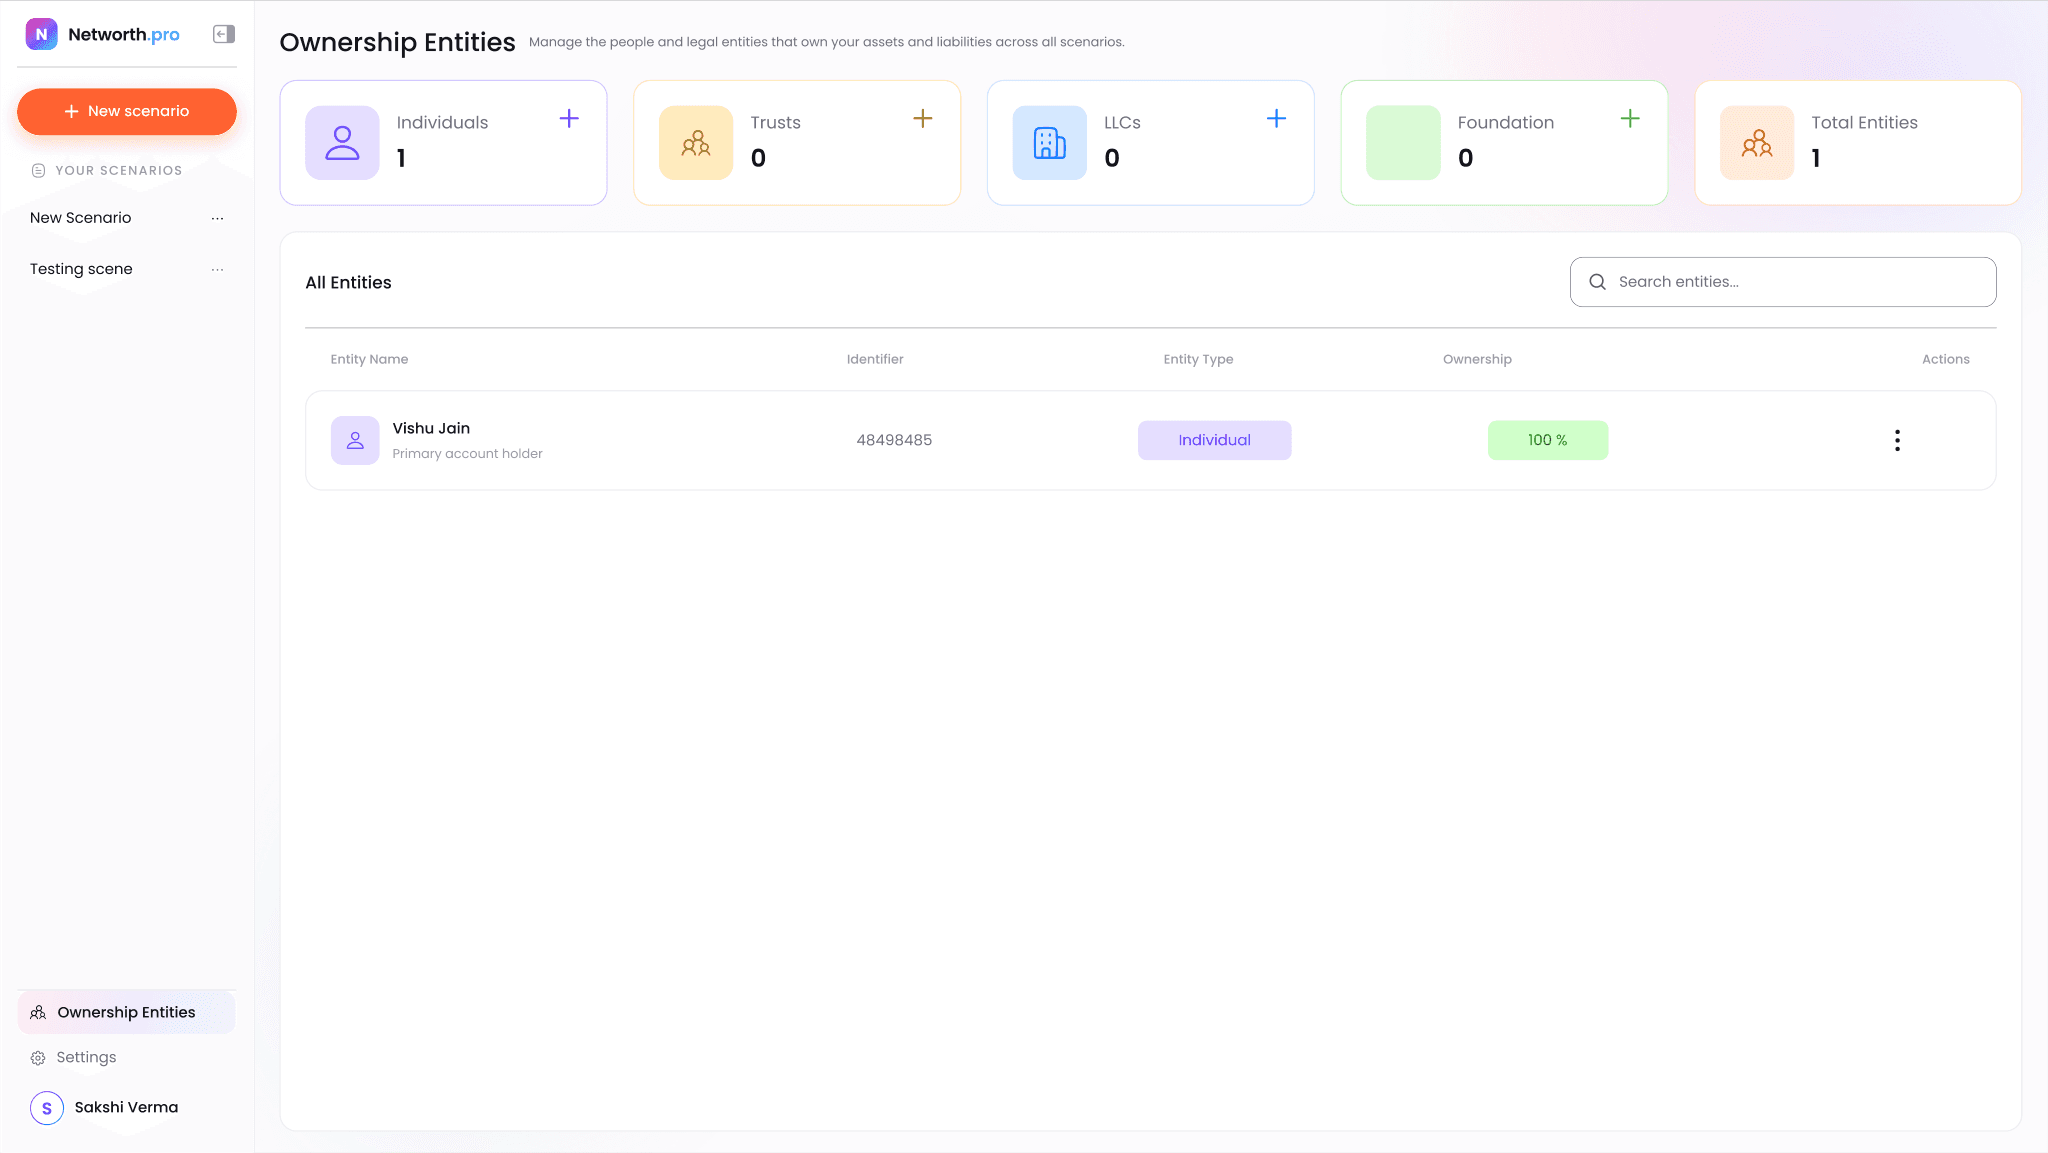
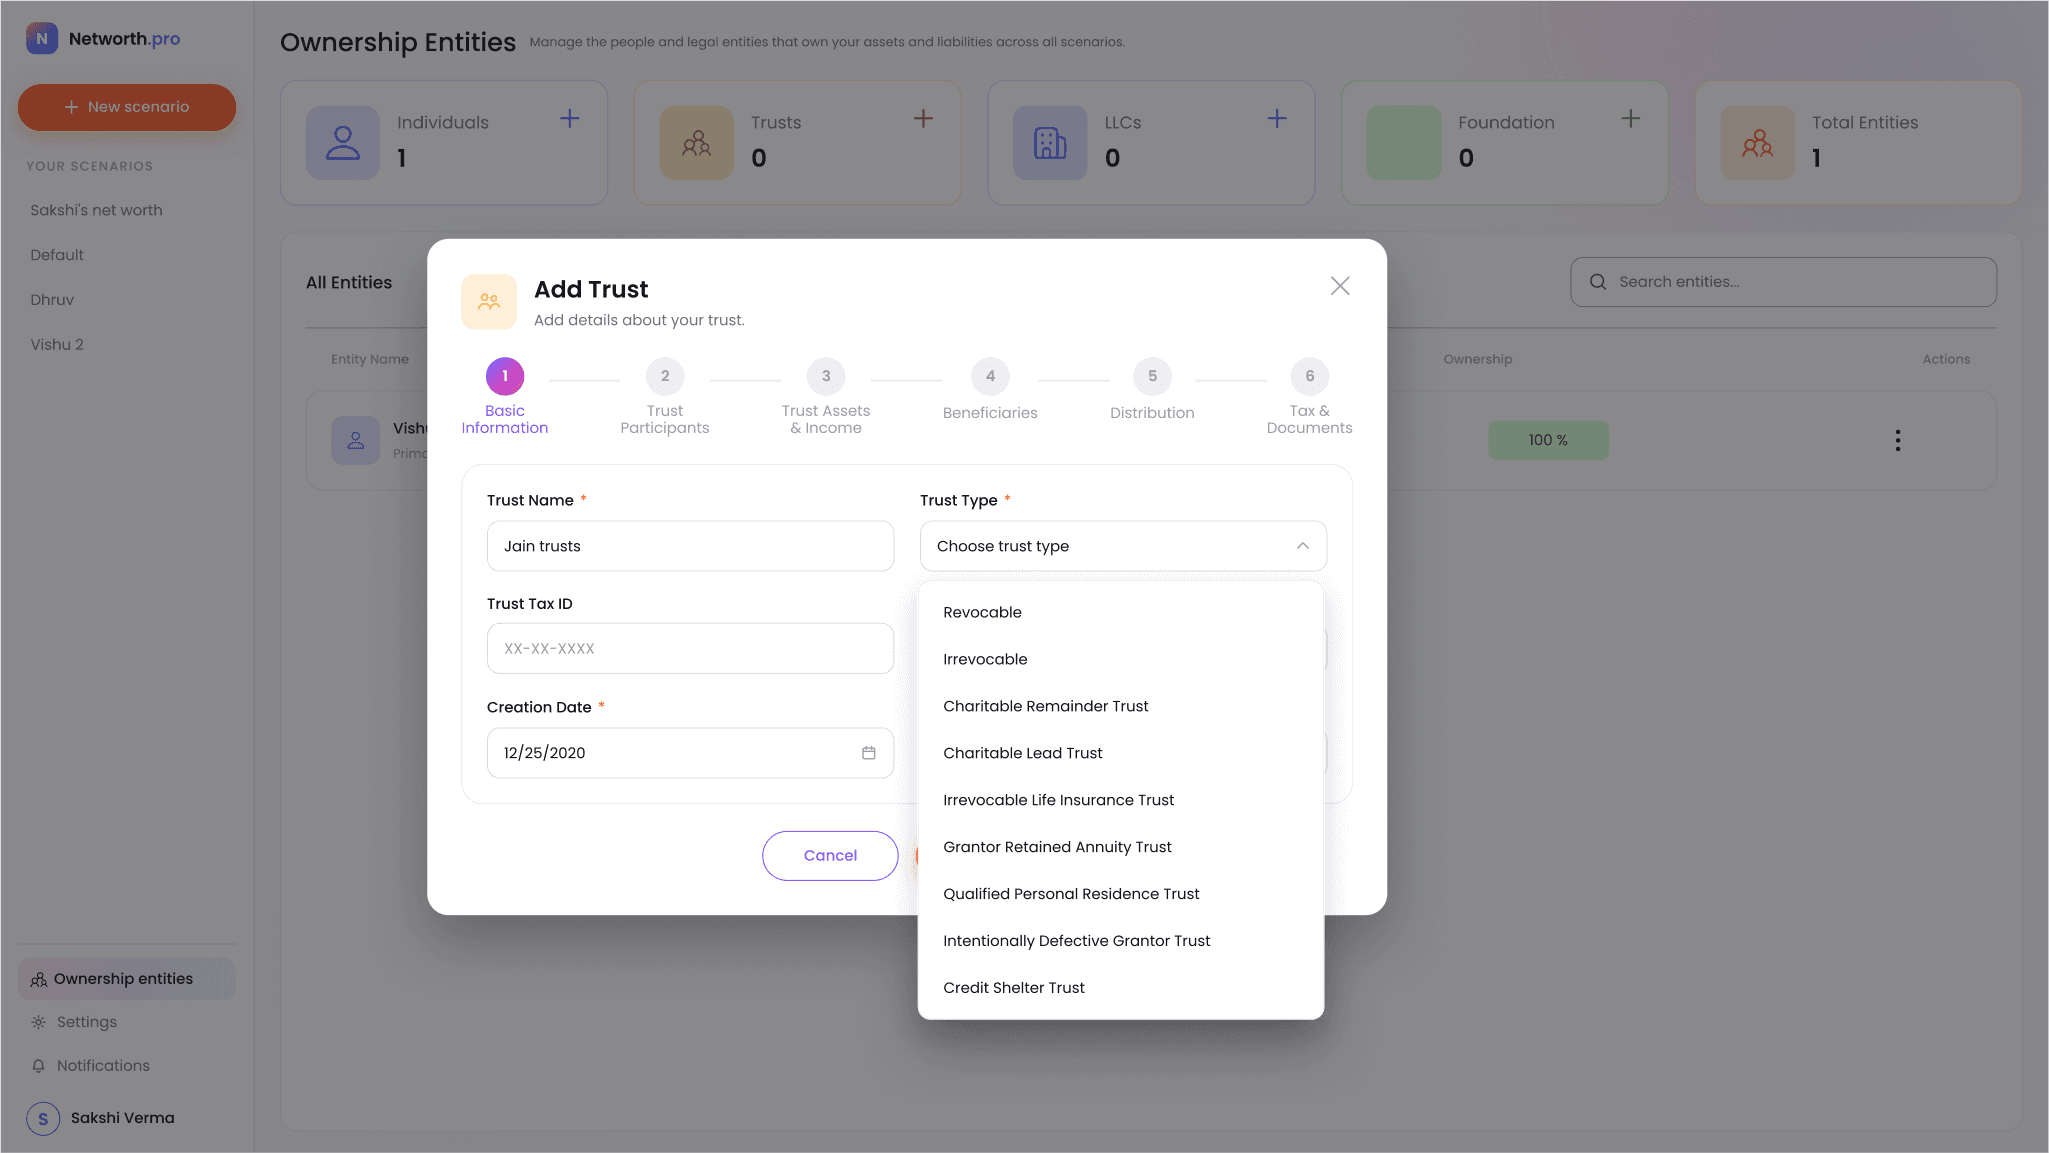
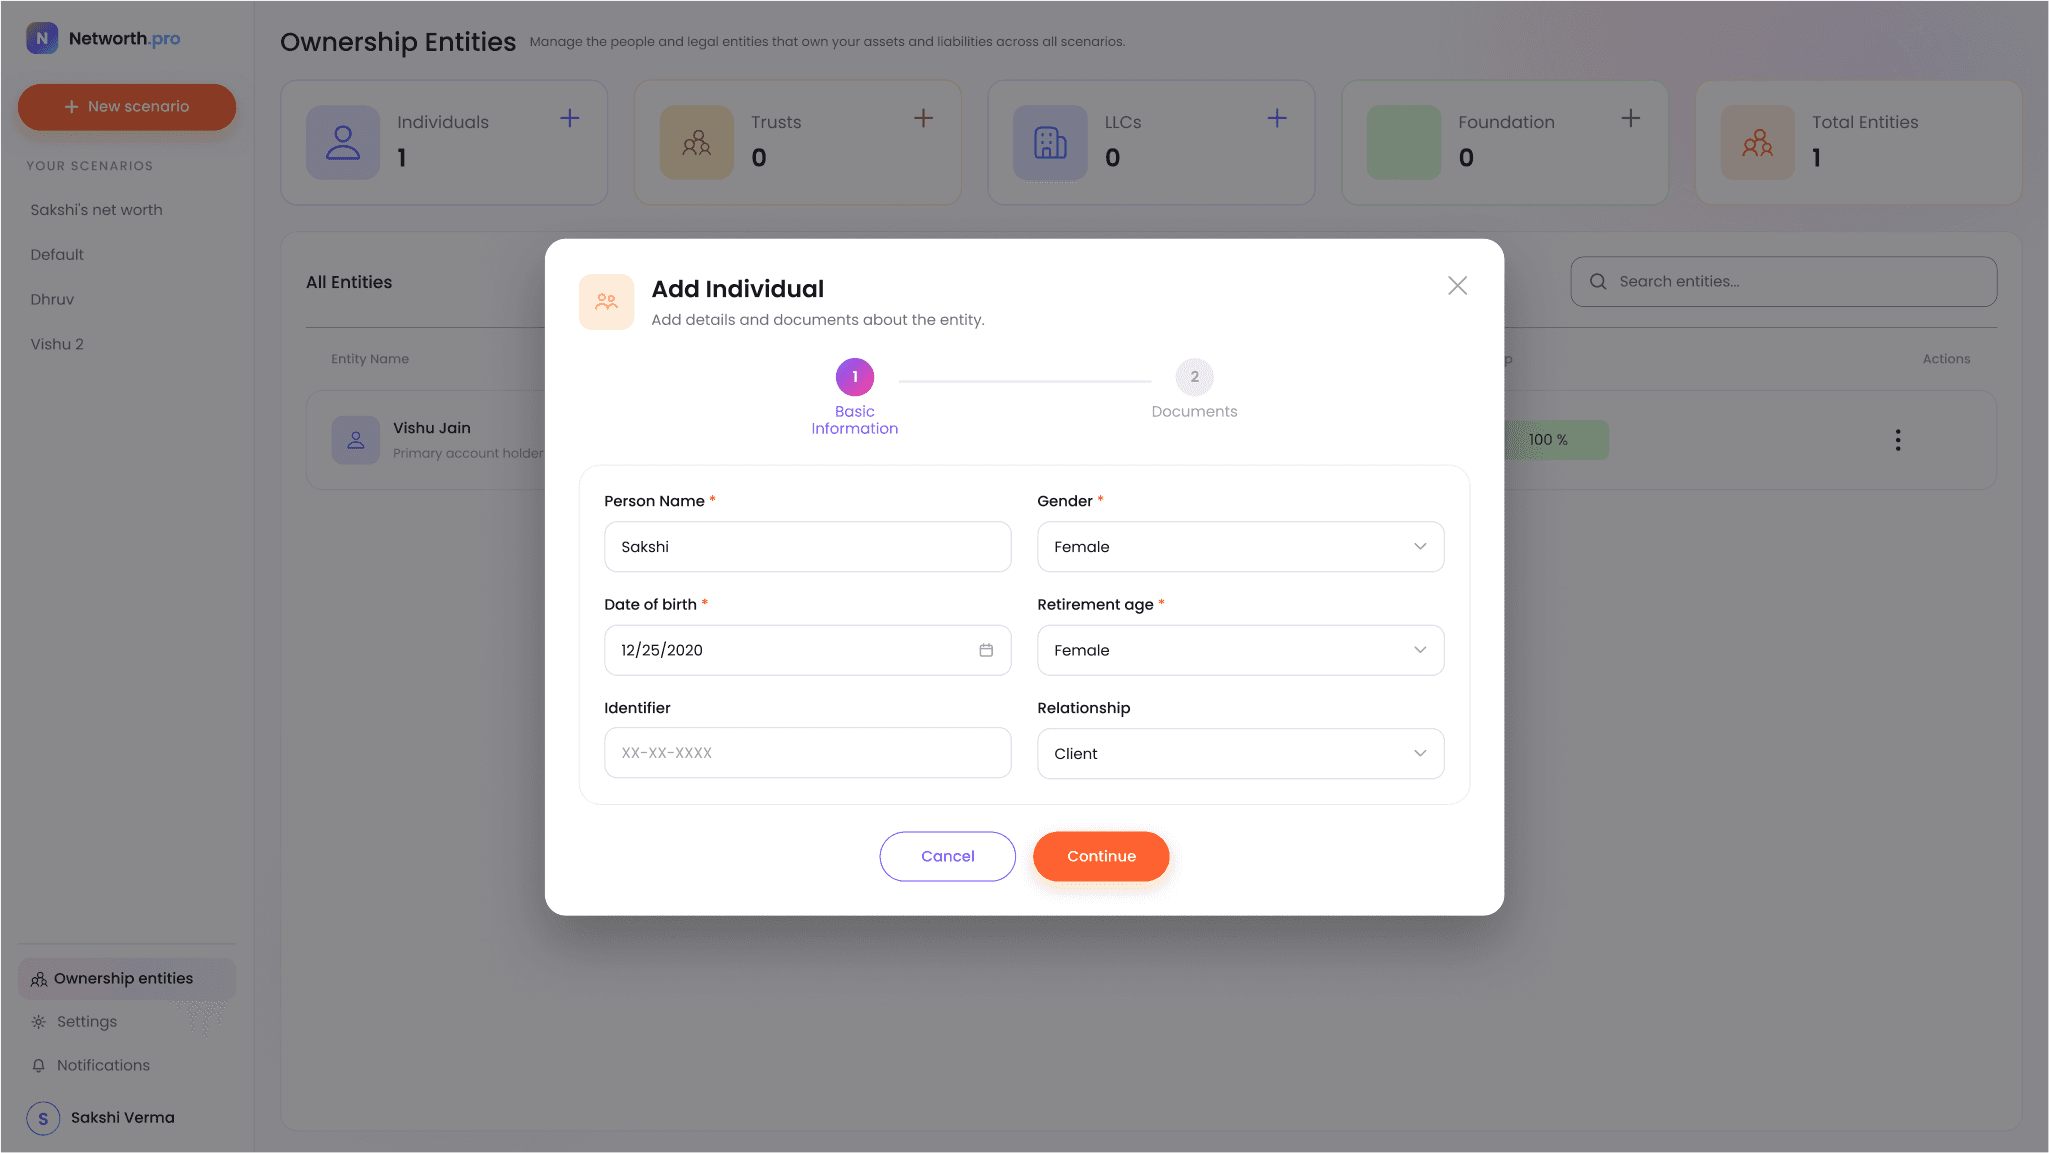
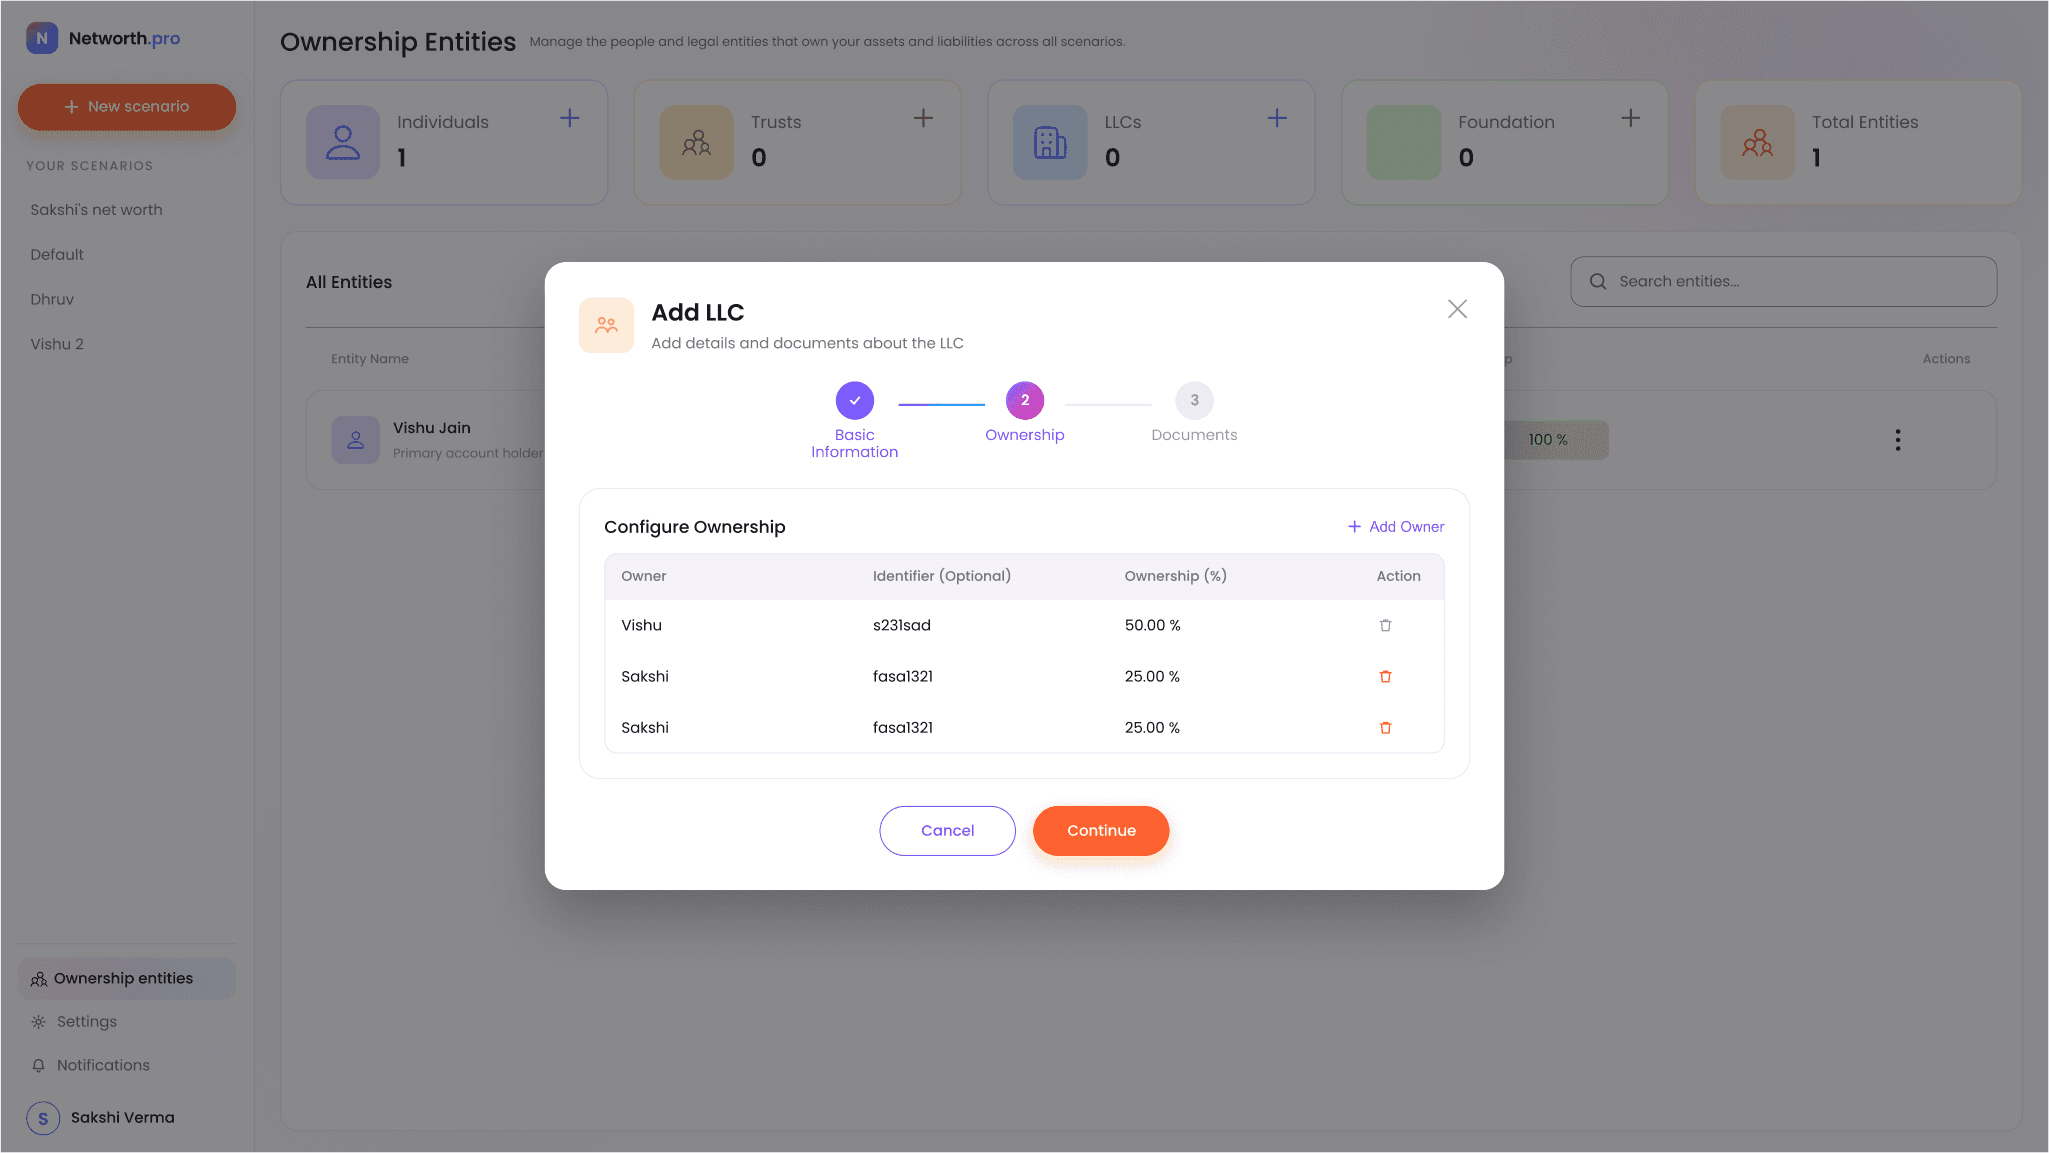
In Ownership Entities I grouped the people and legal entities that own assets and liabilities across every scenario into Individuals, Trusts, LLCs and Foundations. Adding a trust was the most involved flow to design: it covers nine trust types, and each one needs different details.
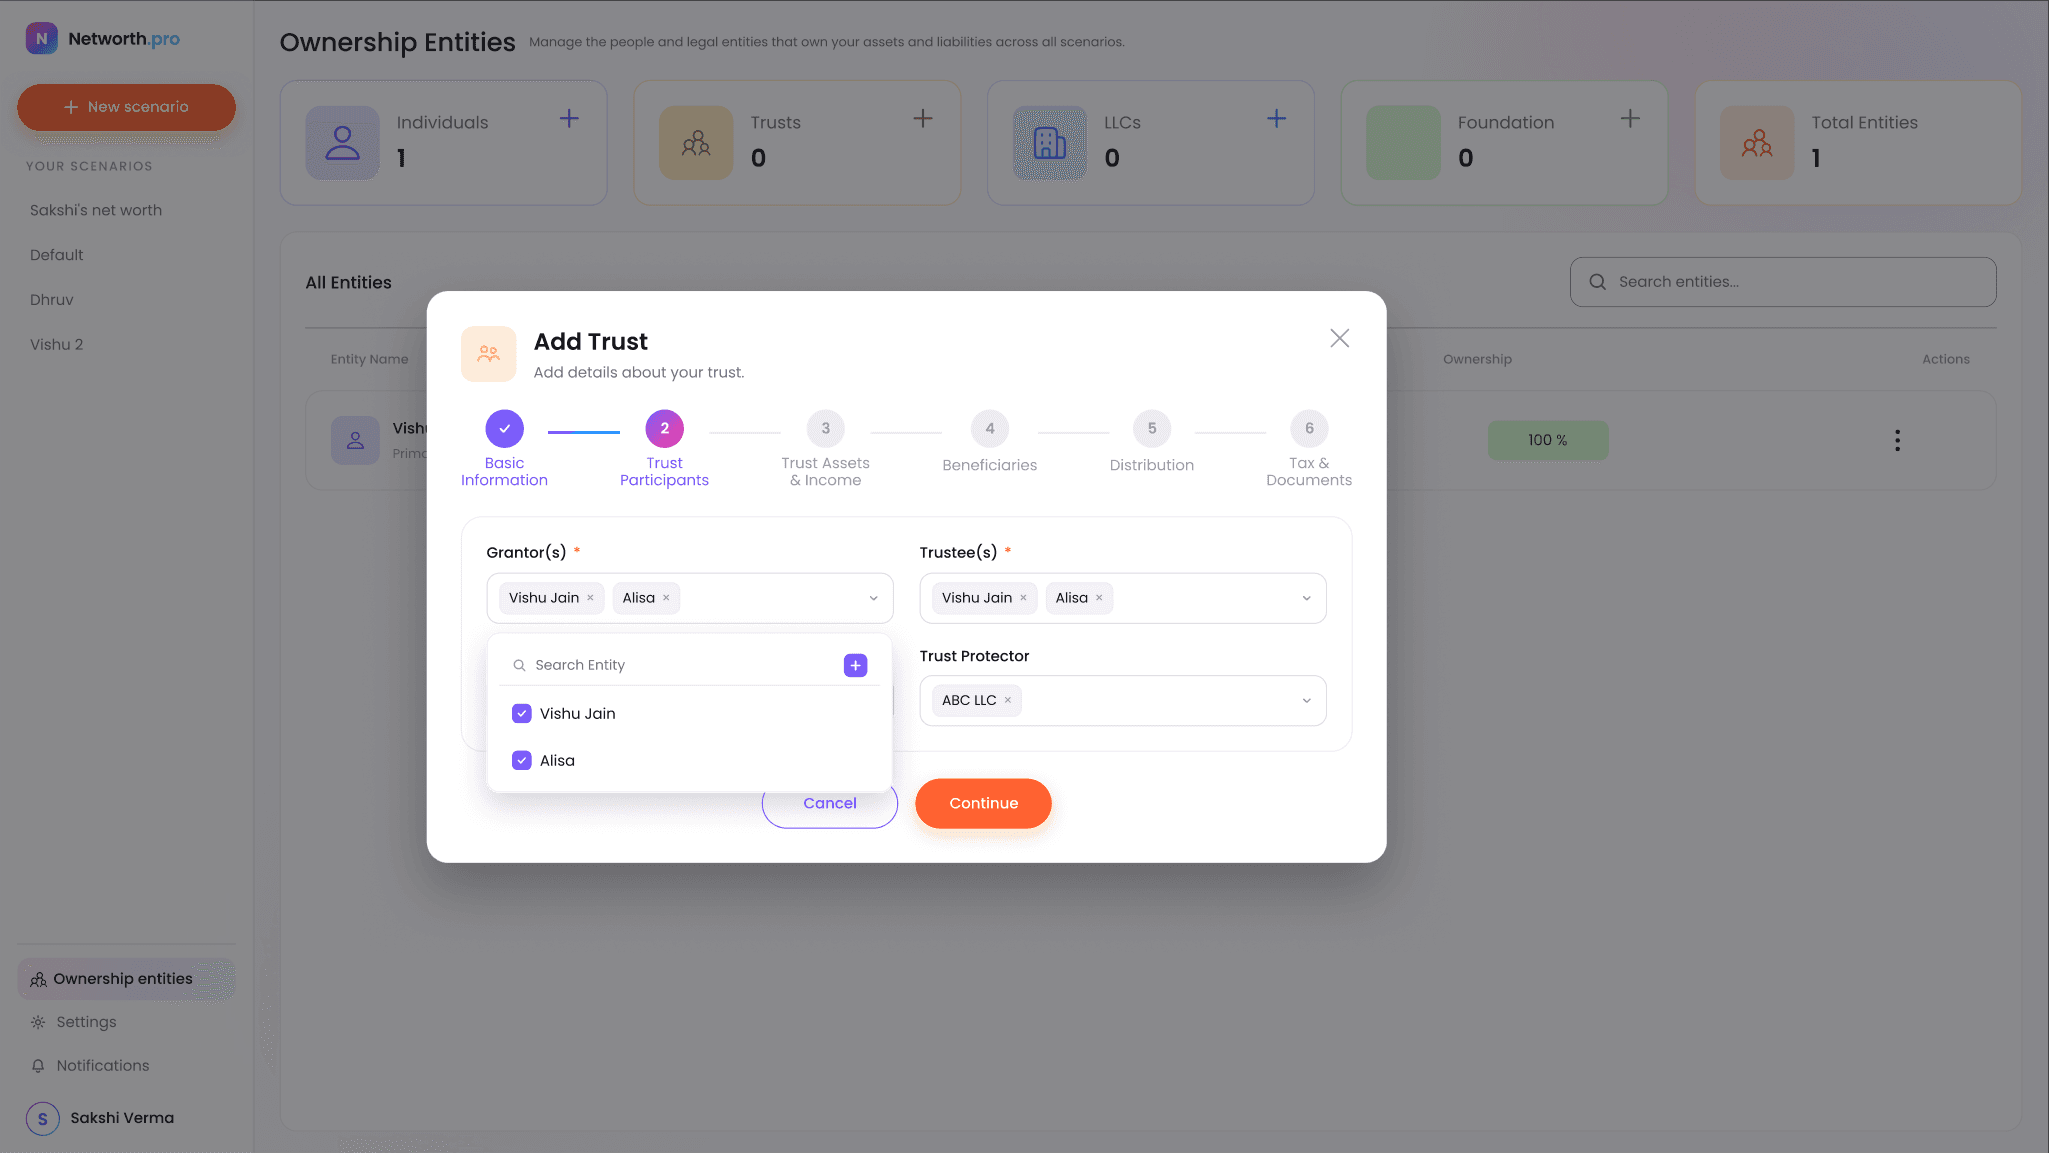
Add Trust: two of its six steps
- 01
Basic information
Name, tax ID, creation date and jurisdiction. The trust type chosen here decides which fields appear in the steps that follow.
- 02
Trust participants
Grantors, trustees, a successor trustee and a trust protector, each picked from existing entities with a searchable multi-select.
09 Settings & system
Building the system underneath.
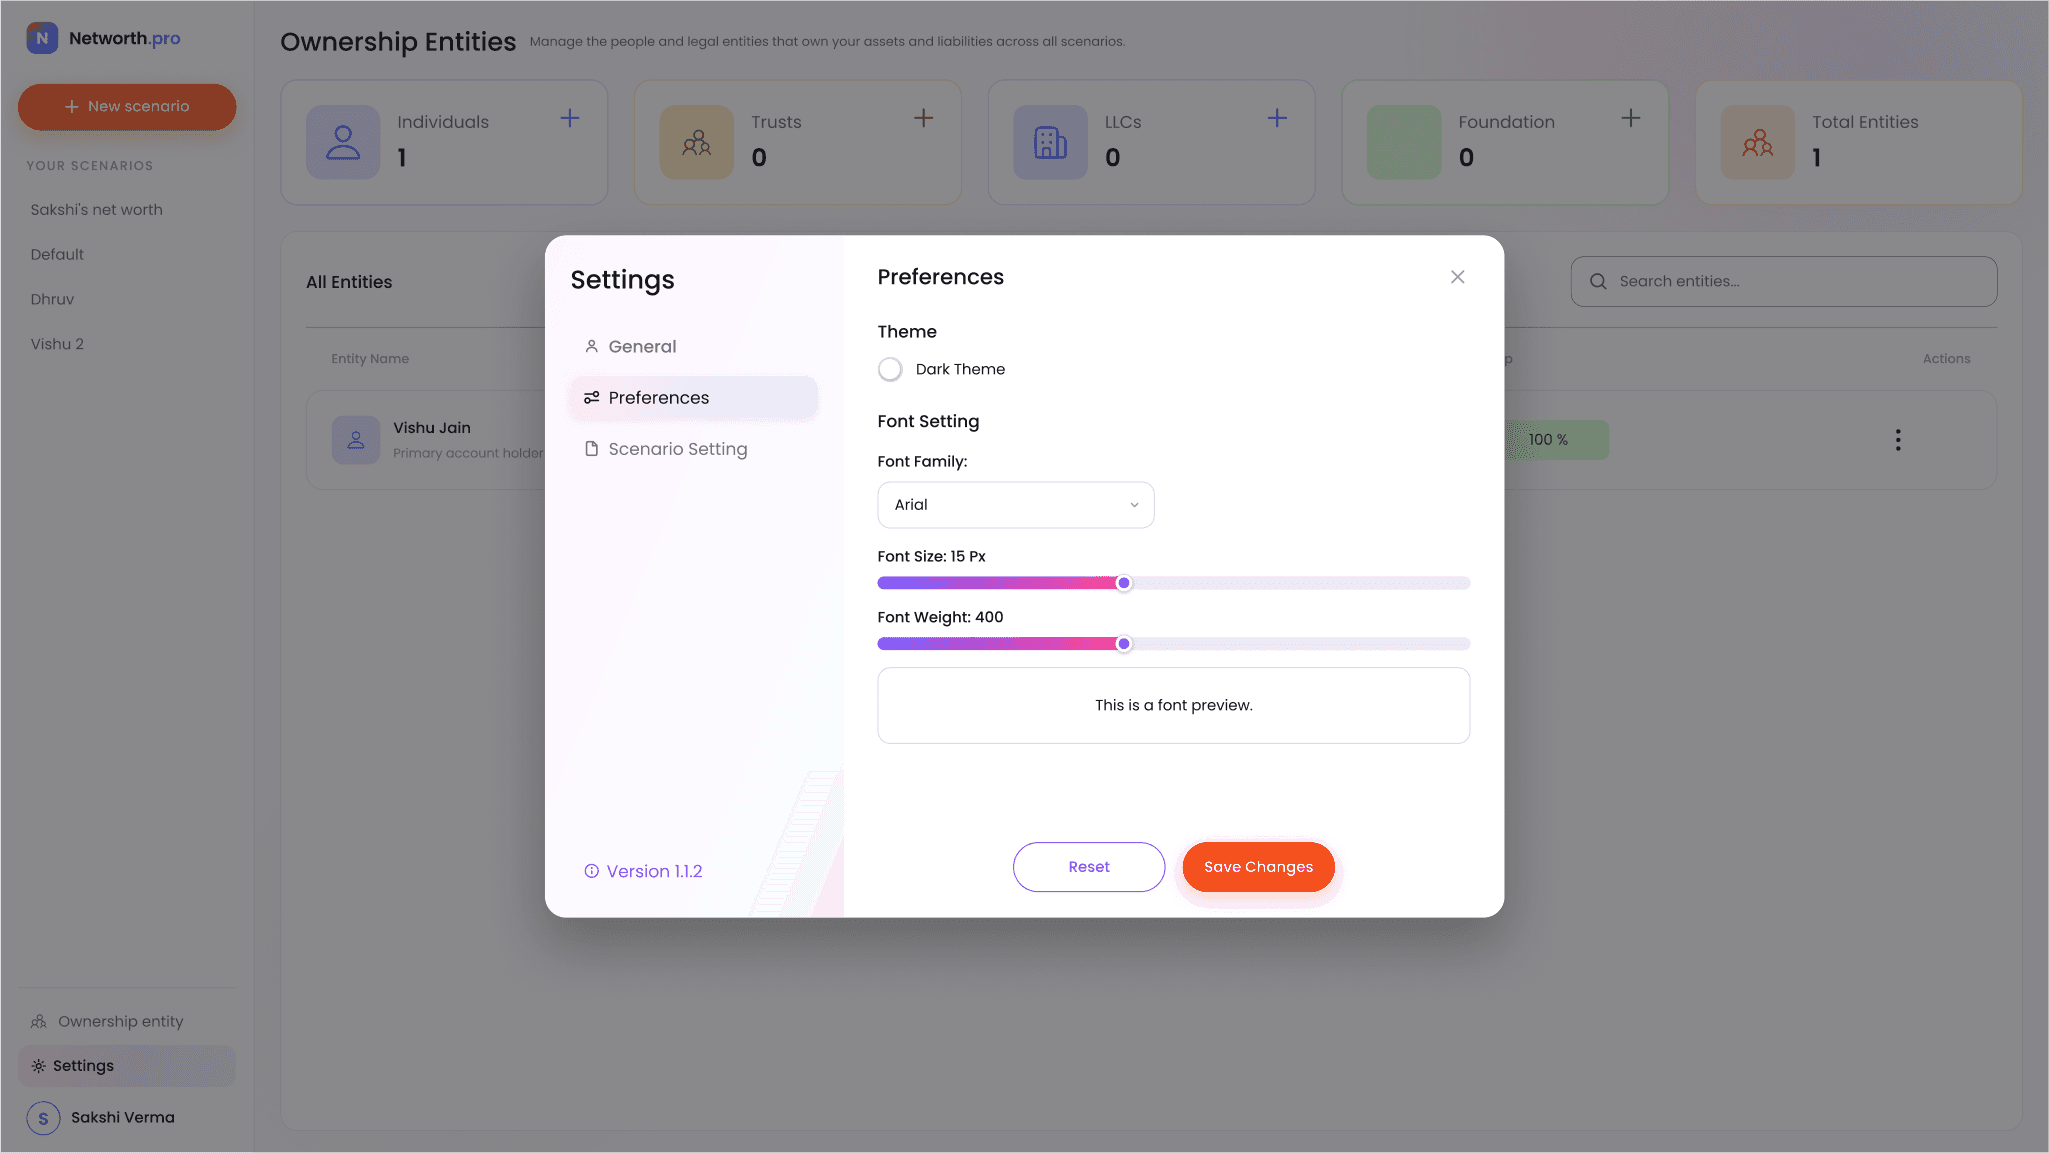
I kept Settings to the profile, display preferences with a live preview, and scenario defaults such as currency. Underneath, I built every screen from one shared component library.