01 Meta Stocks Picker — design phase, 2025
All workRedesigning a 3D stock market visualisation tool
Filtering, configuration, data and saved views lived in separate places. The redesign brings them into one workflow.
- Role
- UX/UI Designer
- Team
- 1 UX Designer (me)1 Engineer1 Founder
- Focus
- UX AuditInformation ArchitecturePrototyping
- Scope
- End-to-end workflow redesign
- Status
- Designed end to end.Partially built, not launched.
01 Overview
Making complex market data easier to explore.
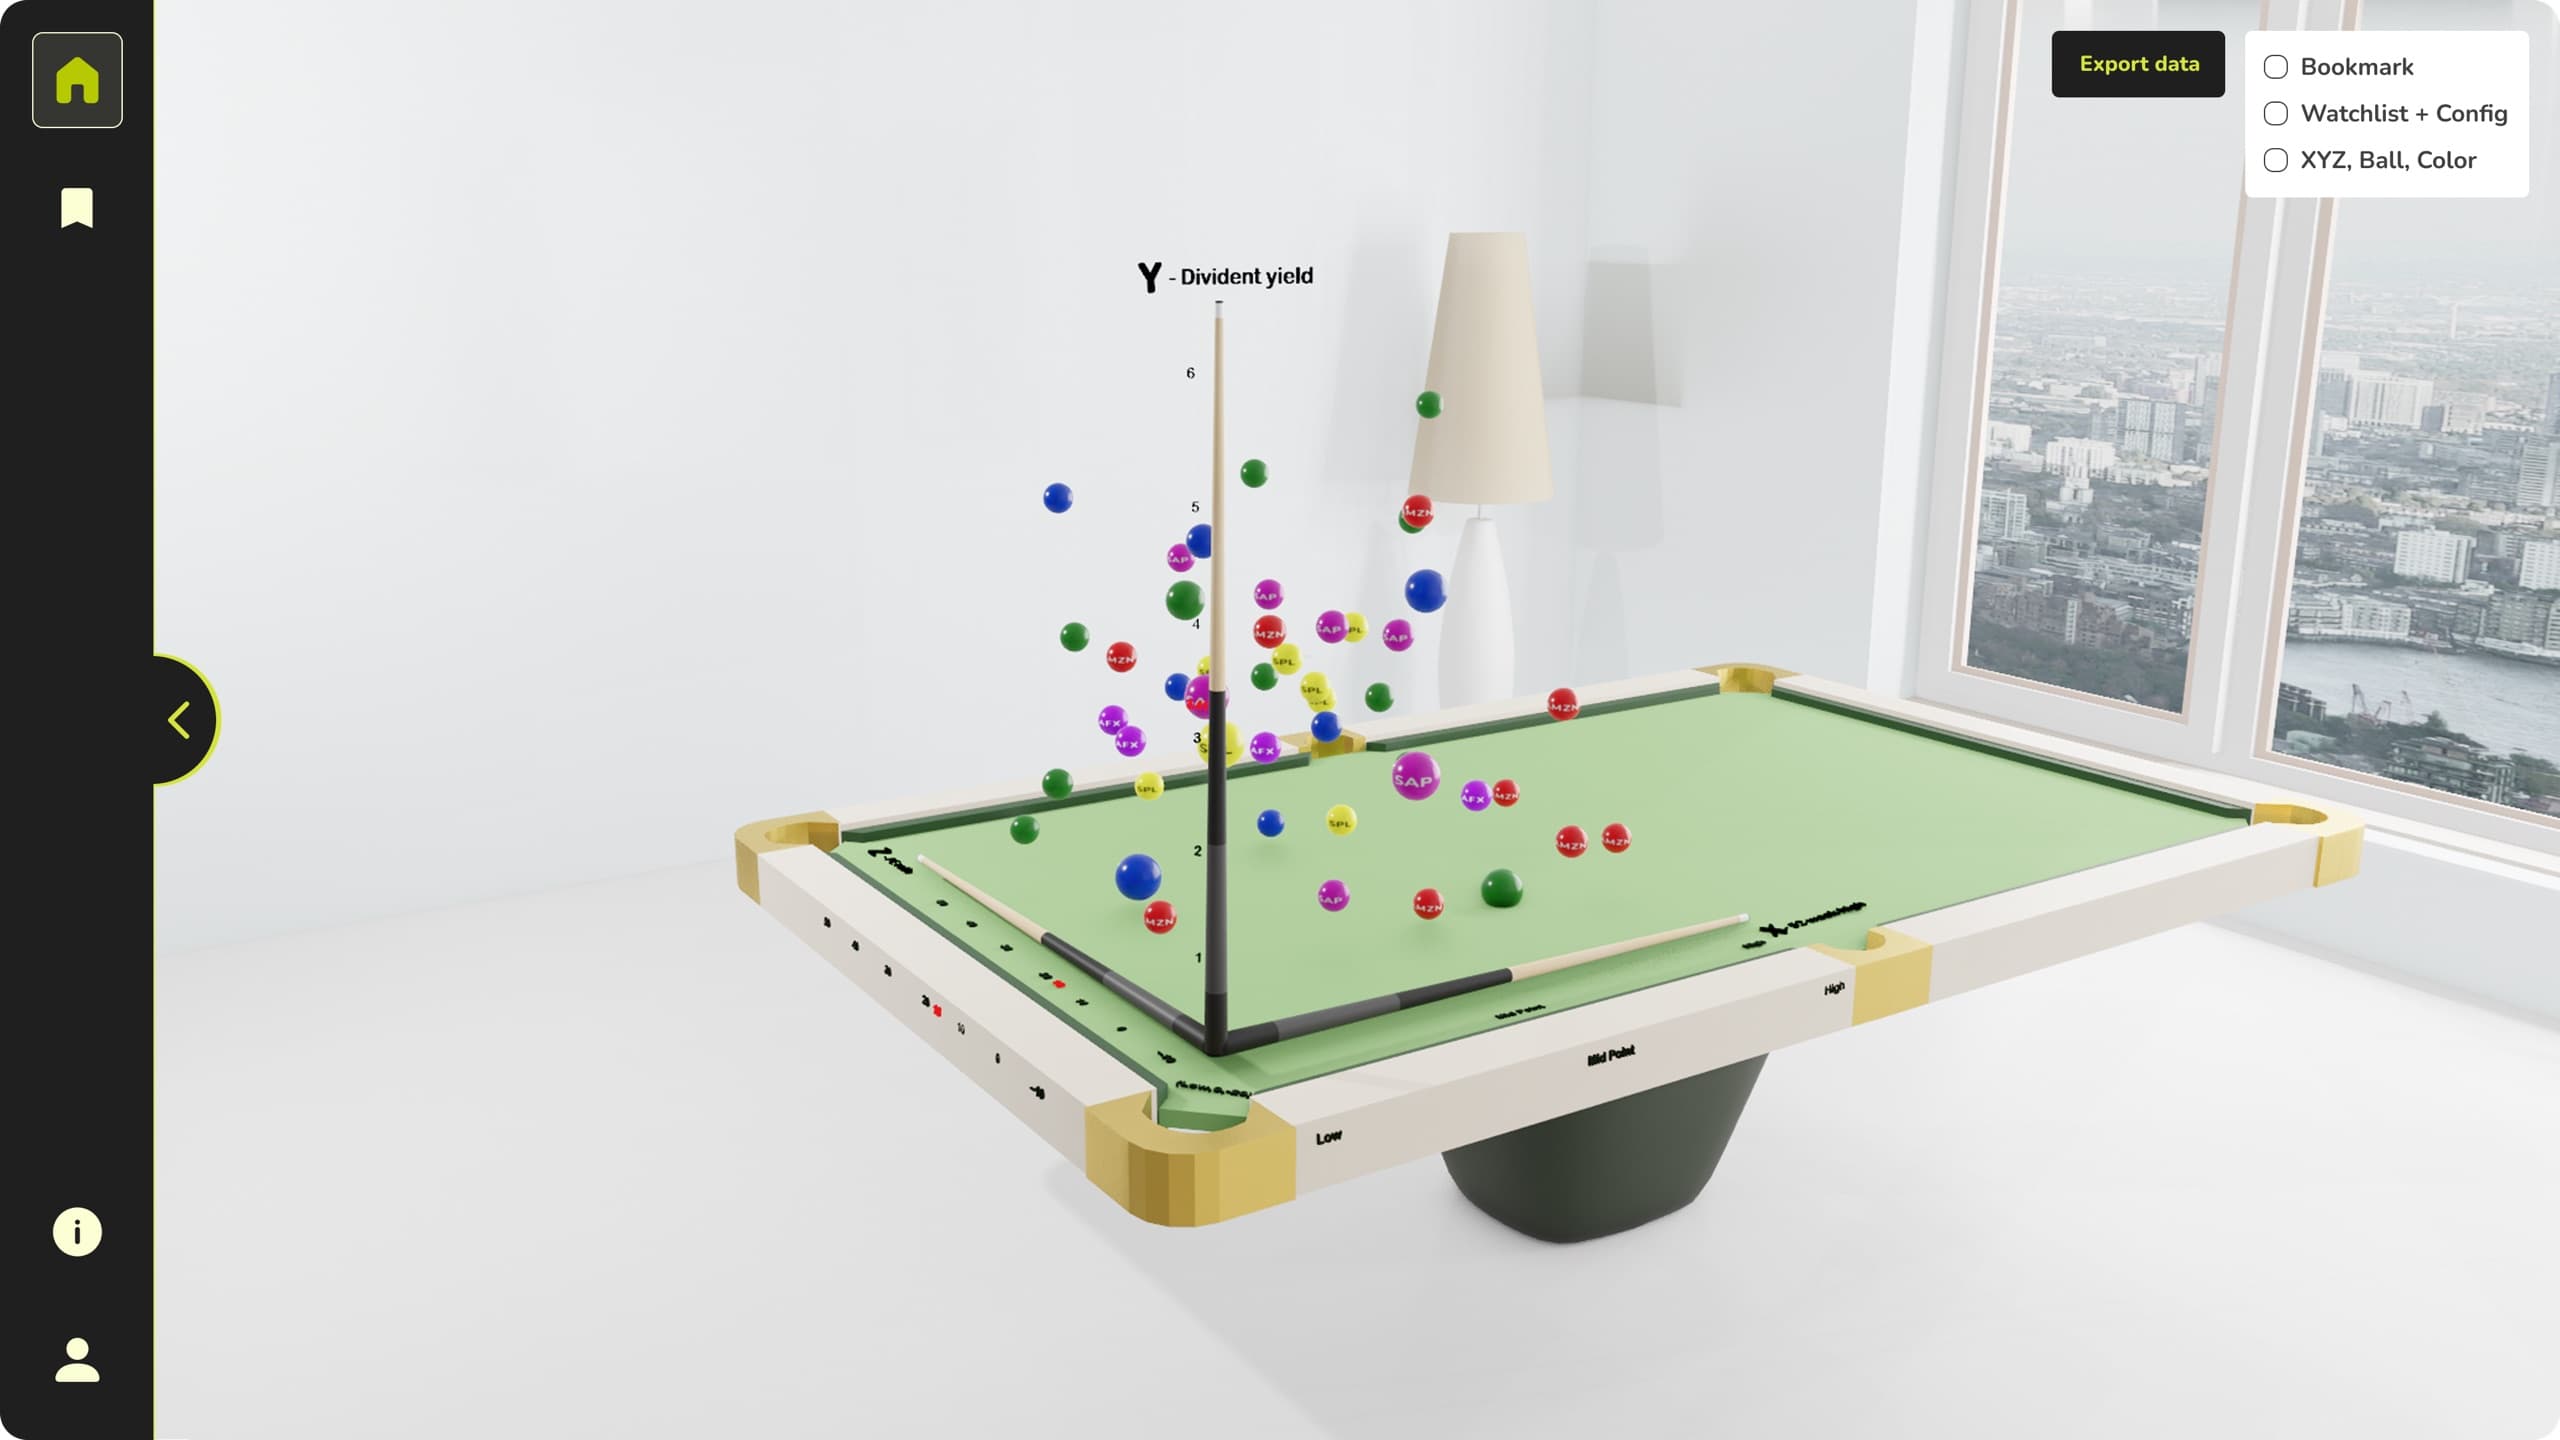
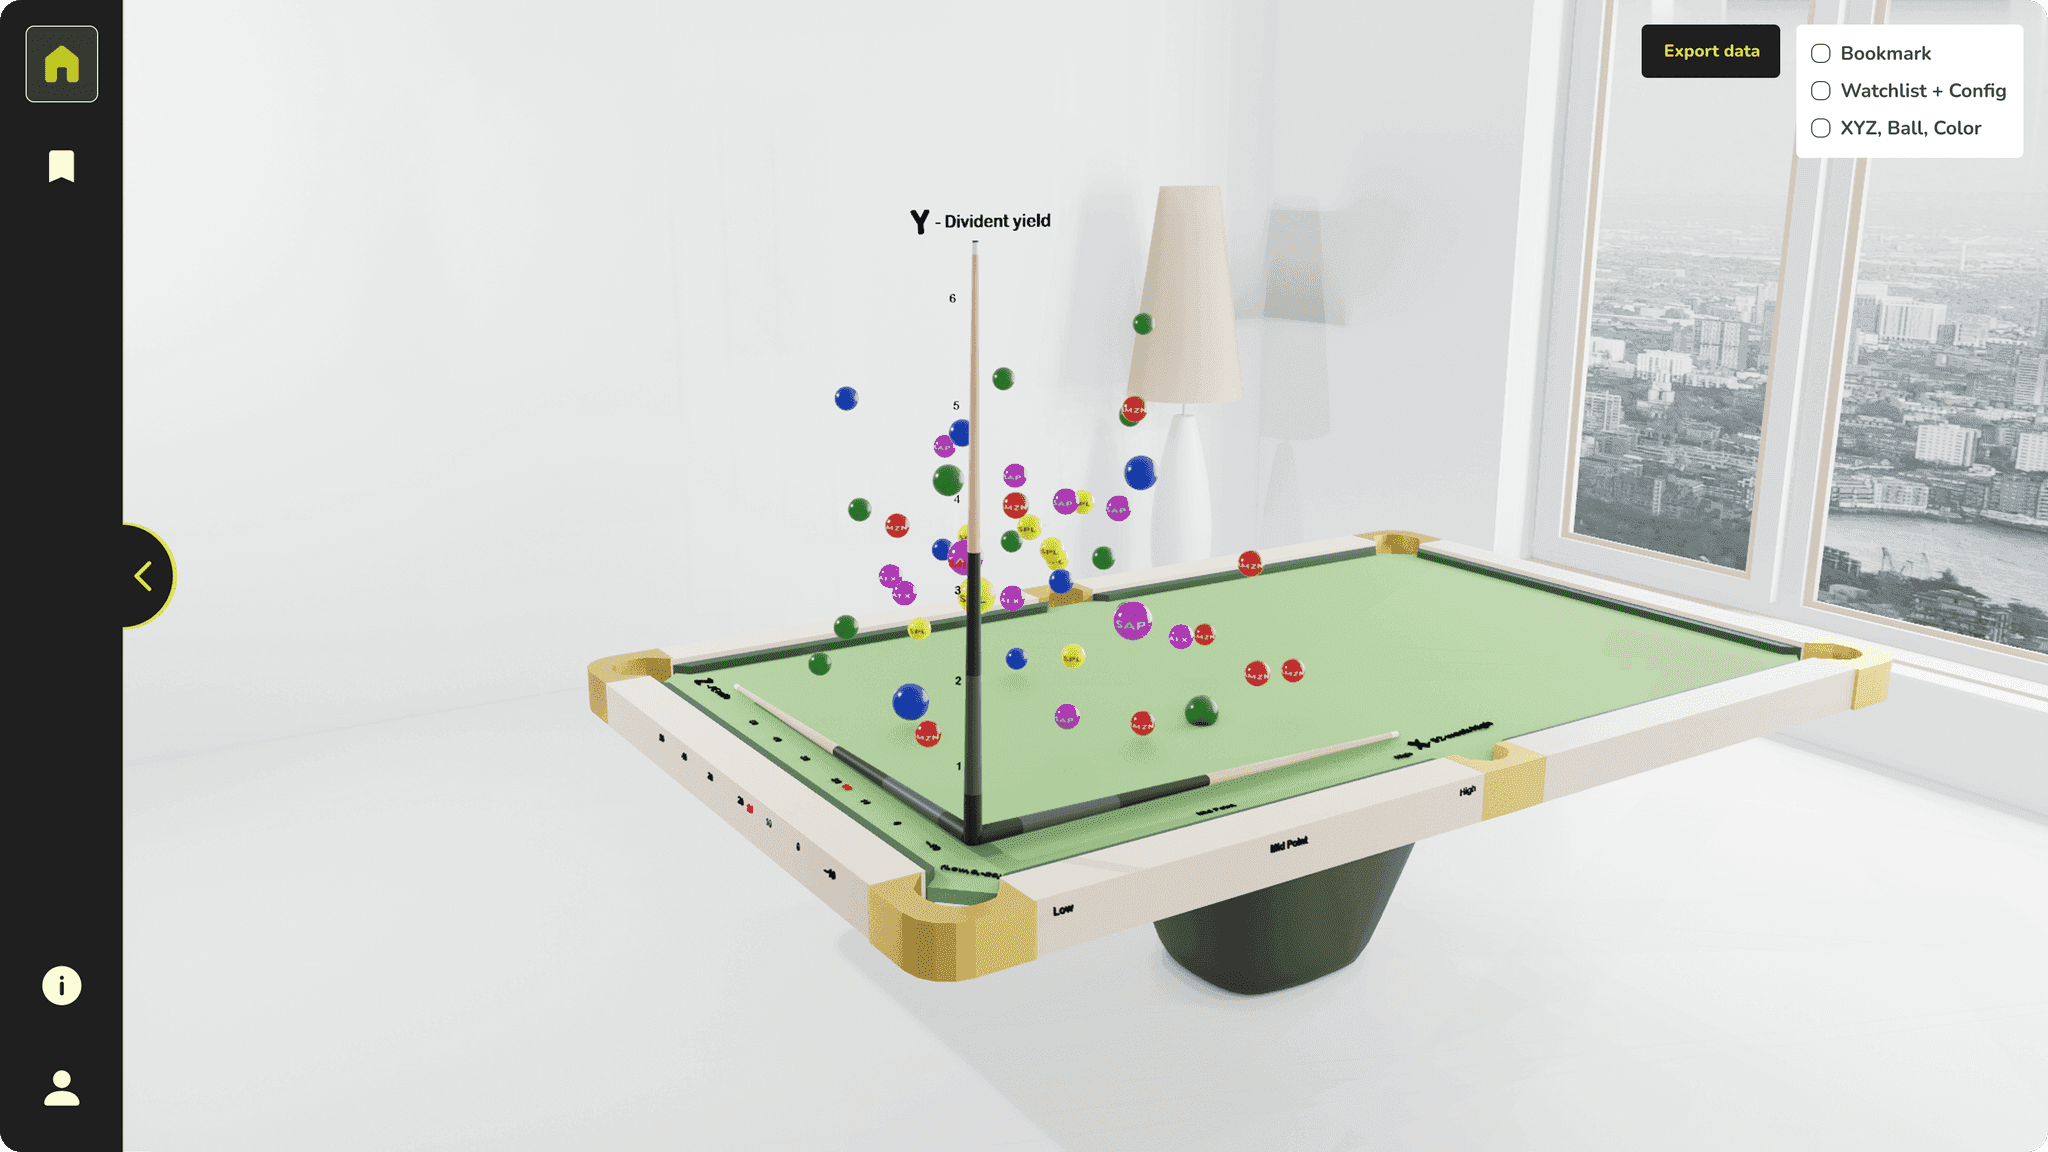
A 3D stock market visualisation platform that helps investors explore how metrics like P/E Ratio, Market Cap and Dividend Yield relate. I joined mid-development and led the redesign of its core workflow—simplifying the information architecture and making data exploration more intuitive.
02 The problem
The product's core workflow was difficult to understand.
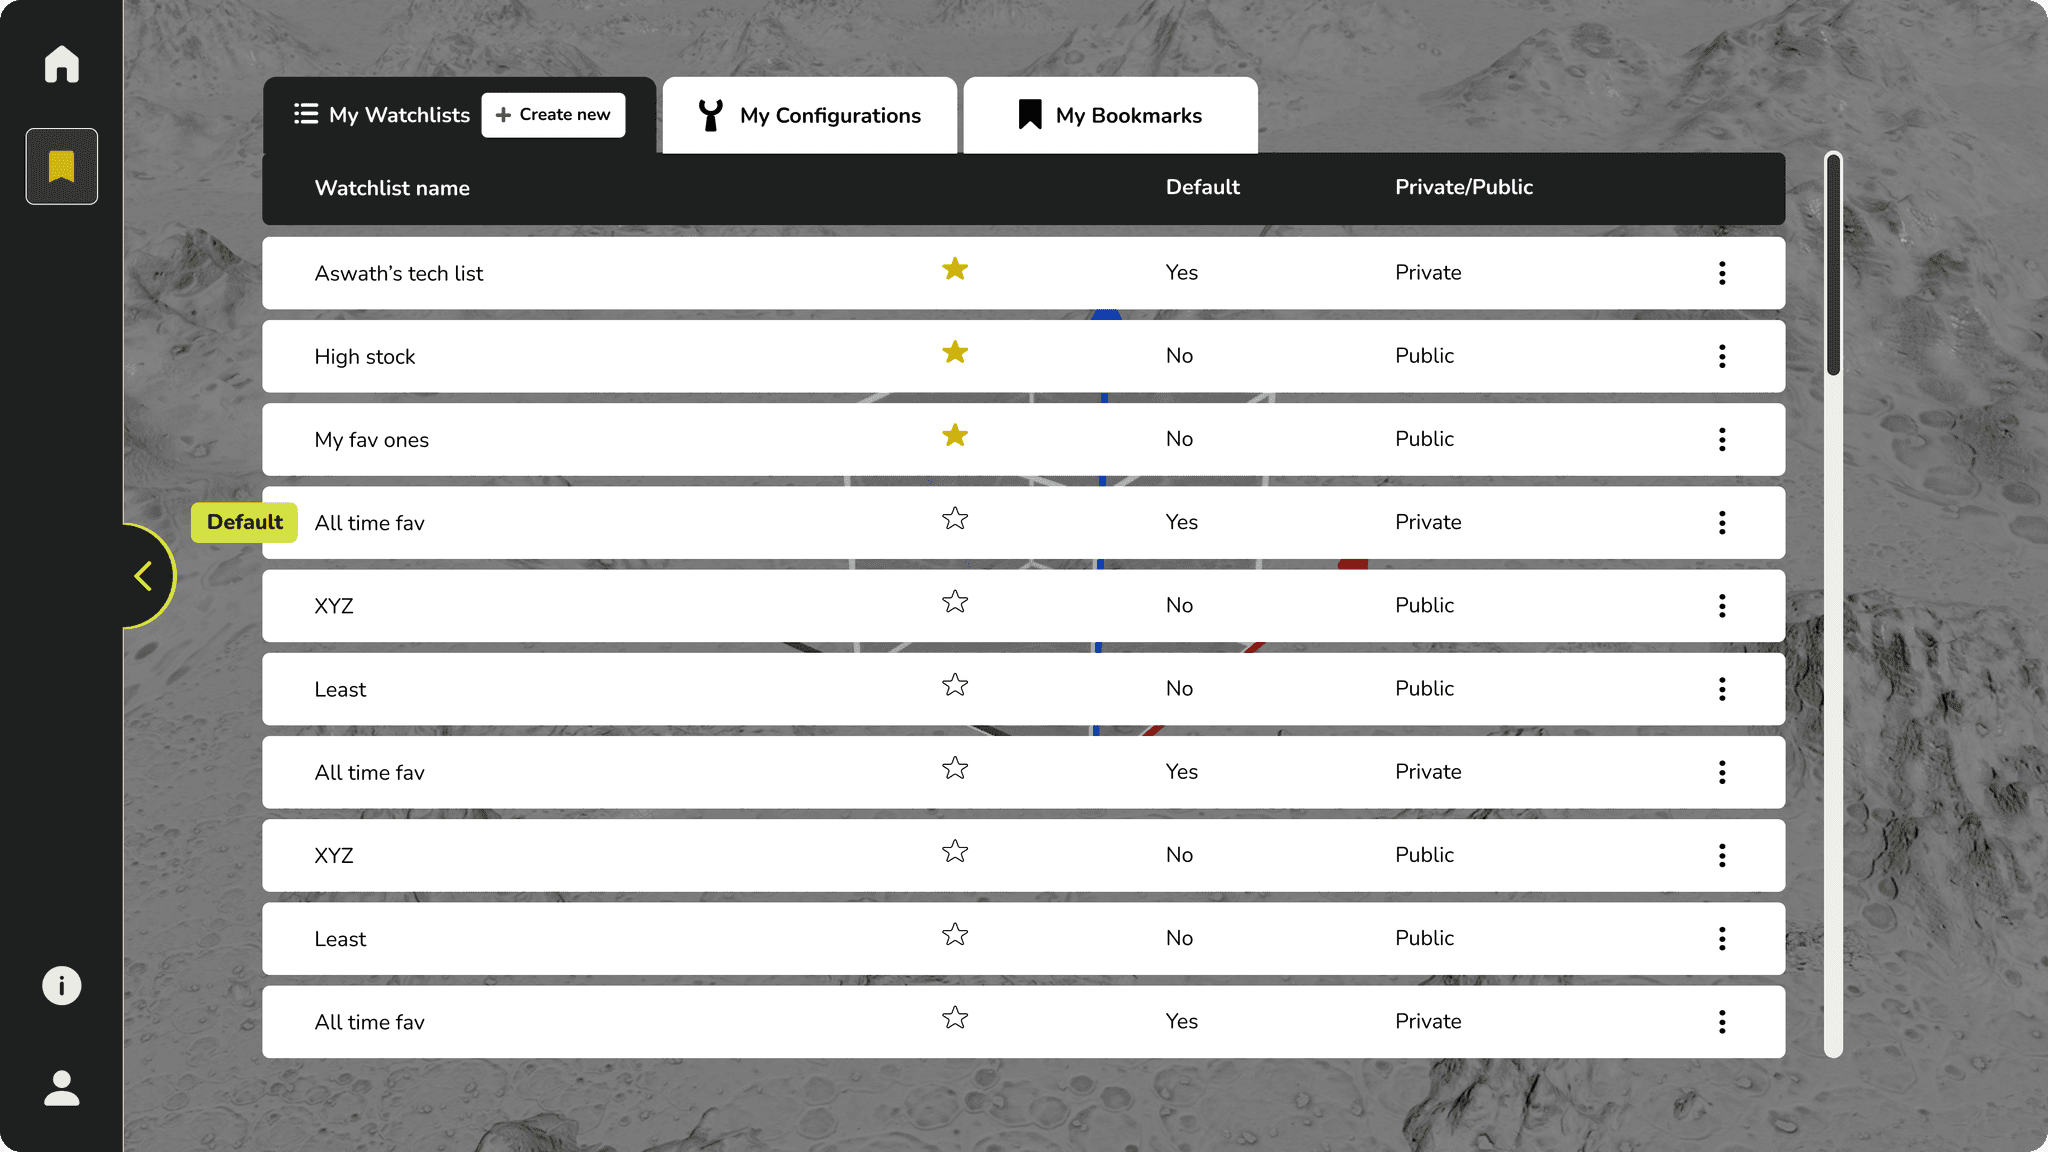
The Bookmark was the foundation of the 3D graph. It combined a Watchlist—the stocks being analysed—with a Configuration—the parameters assigned to each axis. However, users had to create these pieces separately before they could explore the visualisation.
During product walkthroughs, it became clear that users first had to understand the relationship between Watchlists, Configurations, and Bookmarks before the visualisation itself became meaningful. The workflow was essentially “build first, explore later,” creating friction in what should be a continuous analysis experience.
From build first, explore later to explore, refine, and save.
03 Old user flow
Six steps before you could explore.
- 1.
Home
Start from the Home screen
- 2.
Click on the Bookmark icon
Create a Watchlist, Configuration, or Bookmark.
- 3.
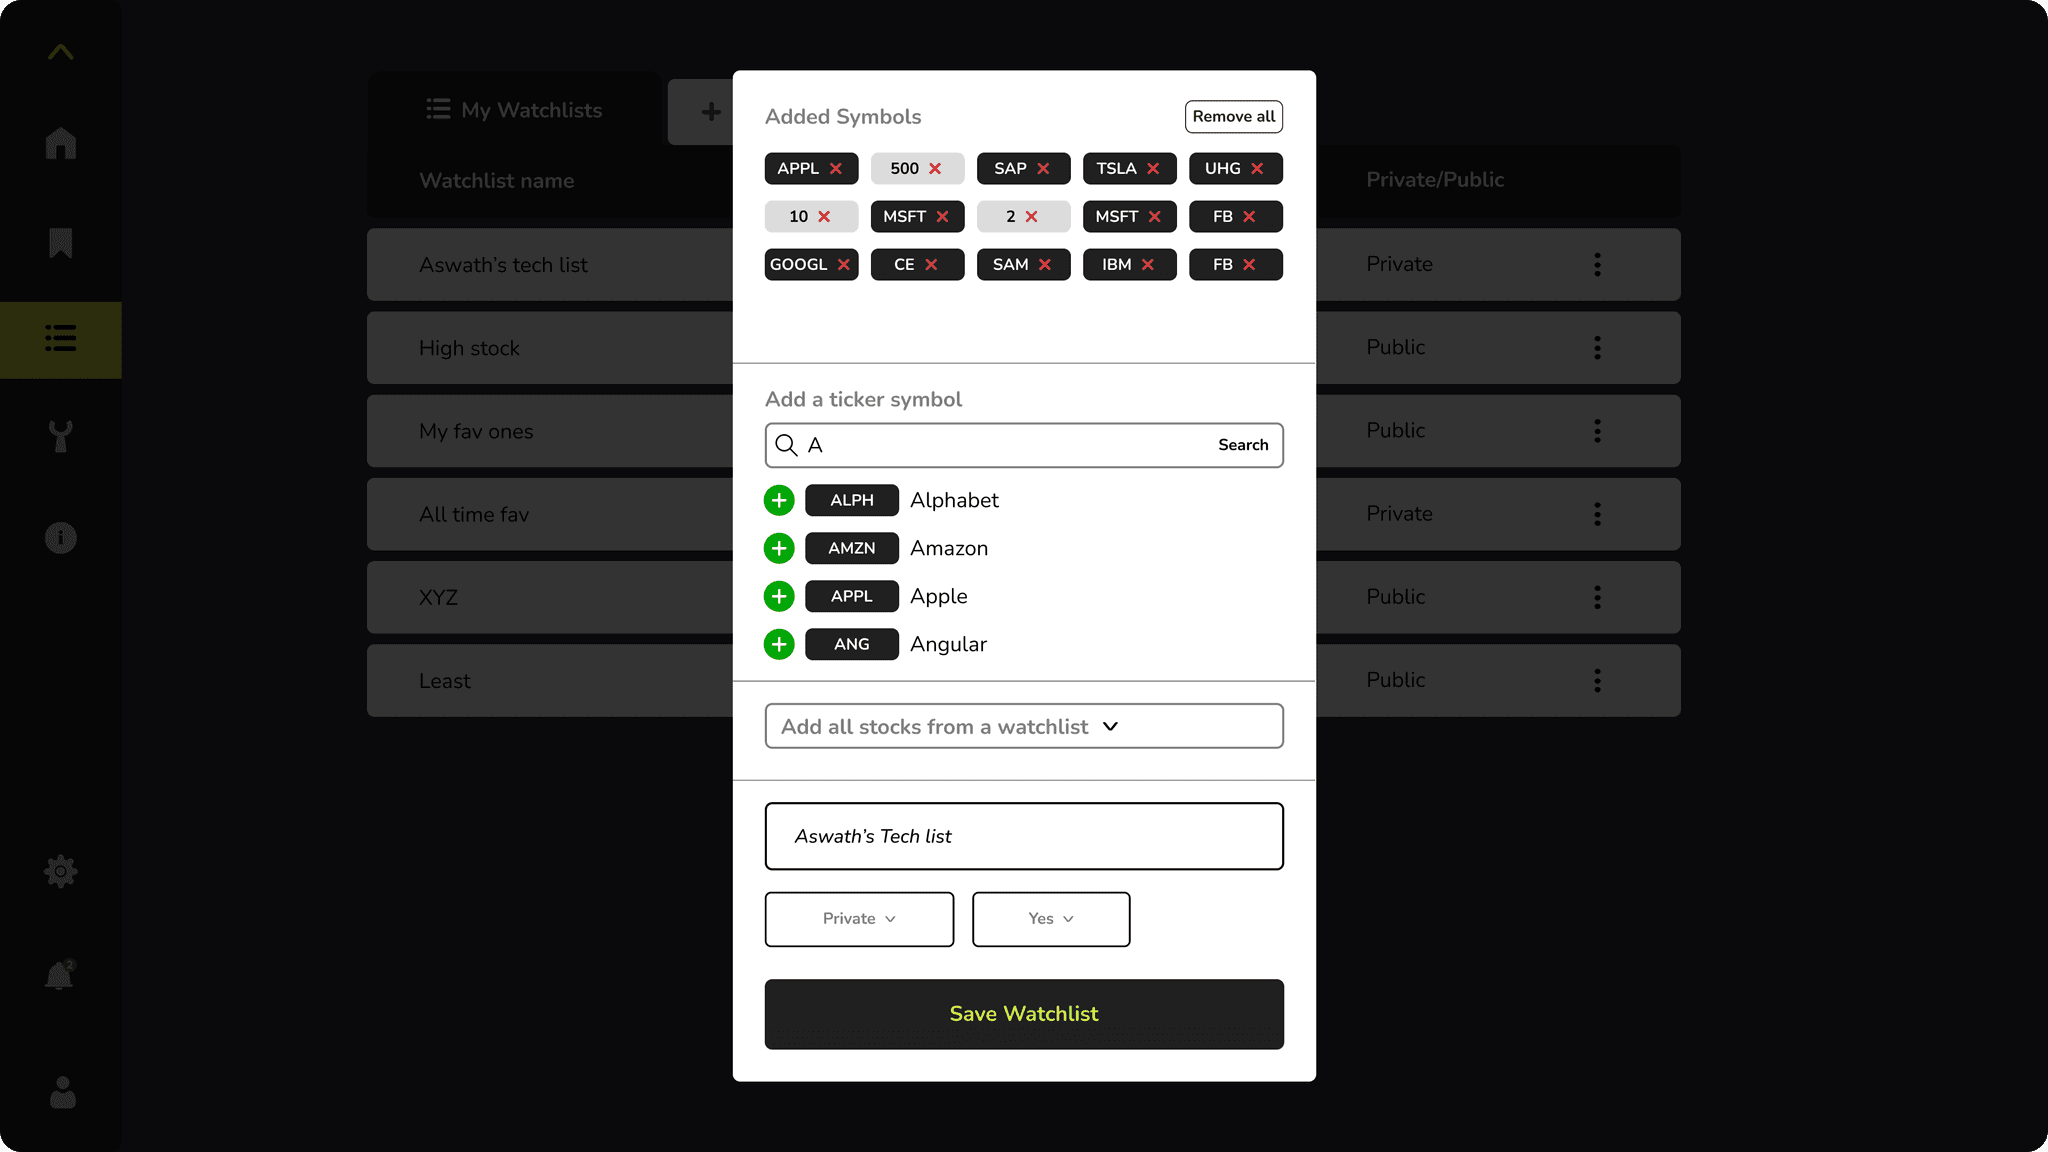
Create Watchlist
Select and save the stocks you want to analyse.
- 4.
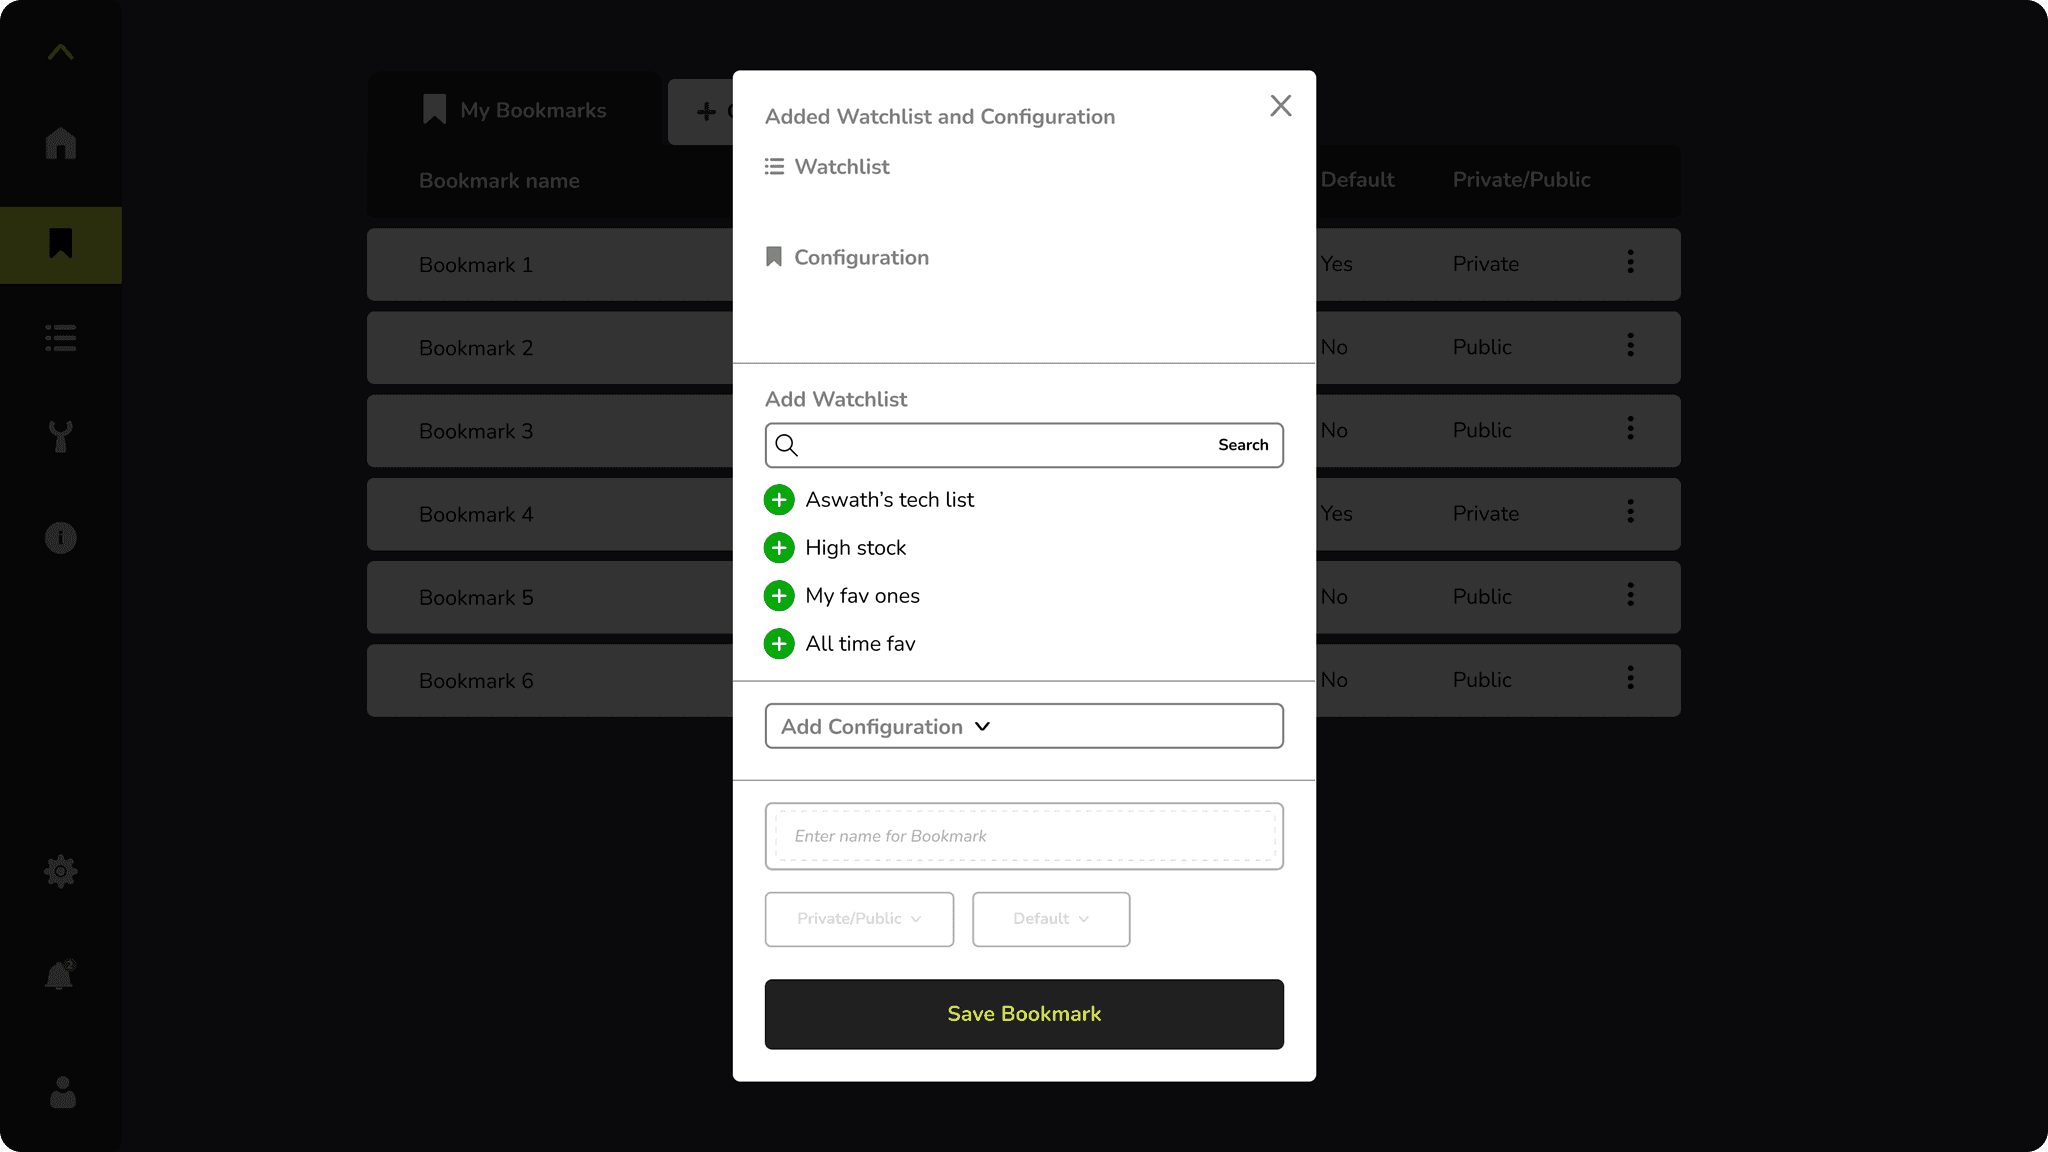
Create Configuration
Choose the metrics and axes for the visualisation.
- 5.
Create Bookmark
Combine Watchlist + Configuration as one saved view.
- 6.
Explore Bookmark
Open the saved Bookmark to explore the analysis.
04 UX audit
Five friction points in the existing flow
- 01
Creation options were hidden behind one entry point
Watchlist, Configuration, and Bookmark creation were all accessed through the same Bookmark icon, making the starting point unclear.
- 02
Watchlist creation was difficult to manage
The small popup limited visibility, making it harder to search, review, and manage multiple stocks.
- 03
Configuration was disconnected from the analysis
Users had to leave the graph and open a separate popup to configure the visualisation.
- 04
The relationship between Watchlist, Configuration, and Bookmark was unclear
Users had to understand that a Bookmark combines a Watchlist and Configuration, adding unnecessary cognitive load.
- 05
The graph lacked supporting data
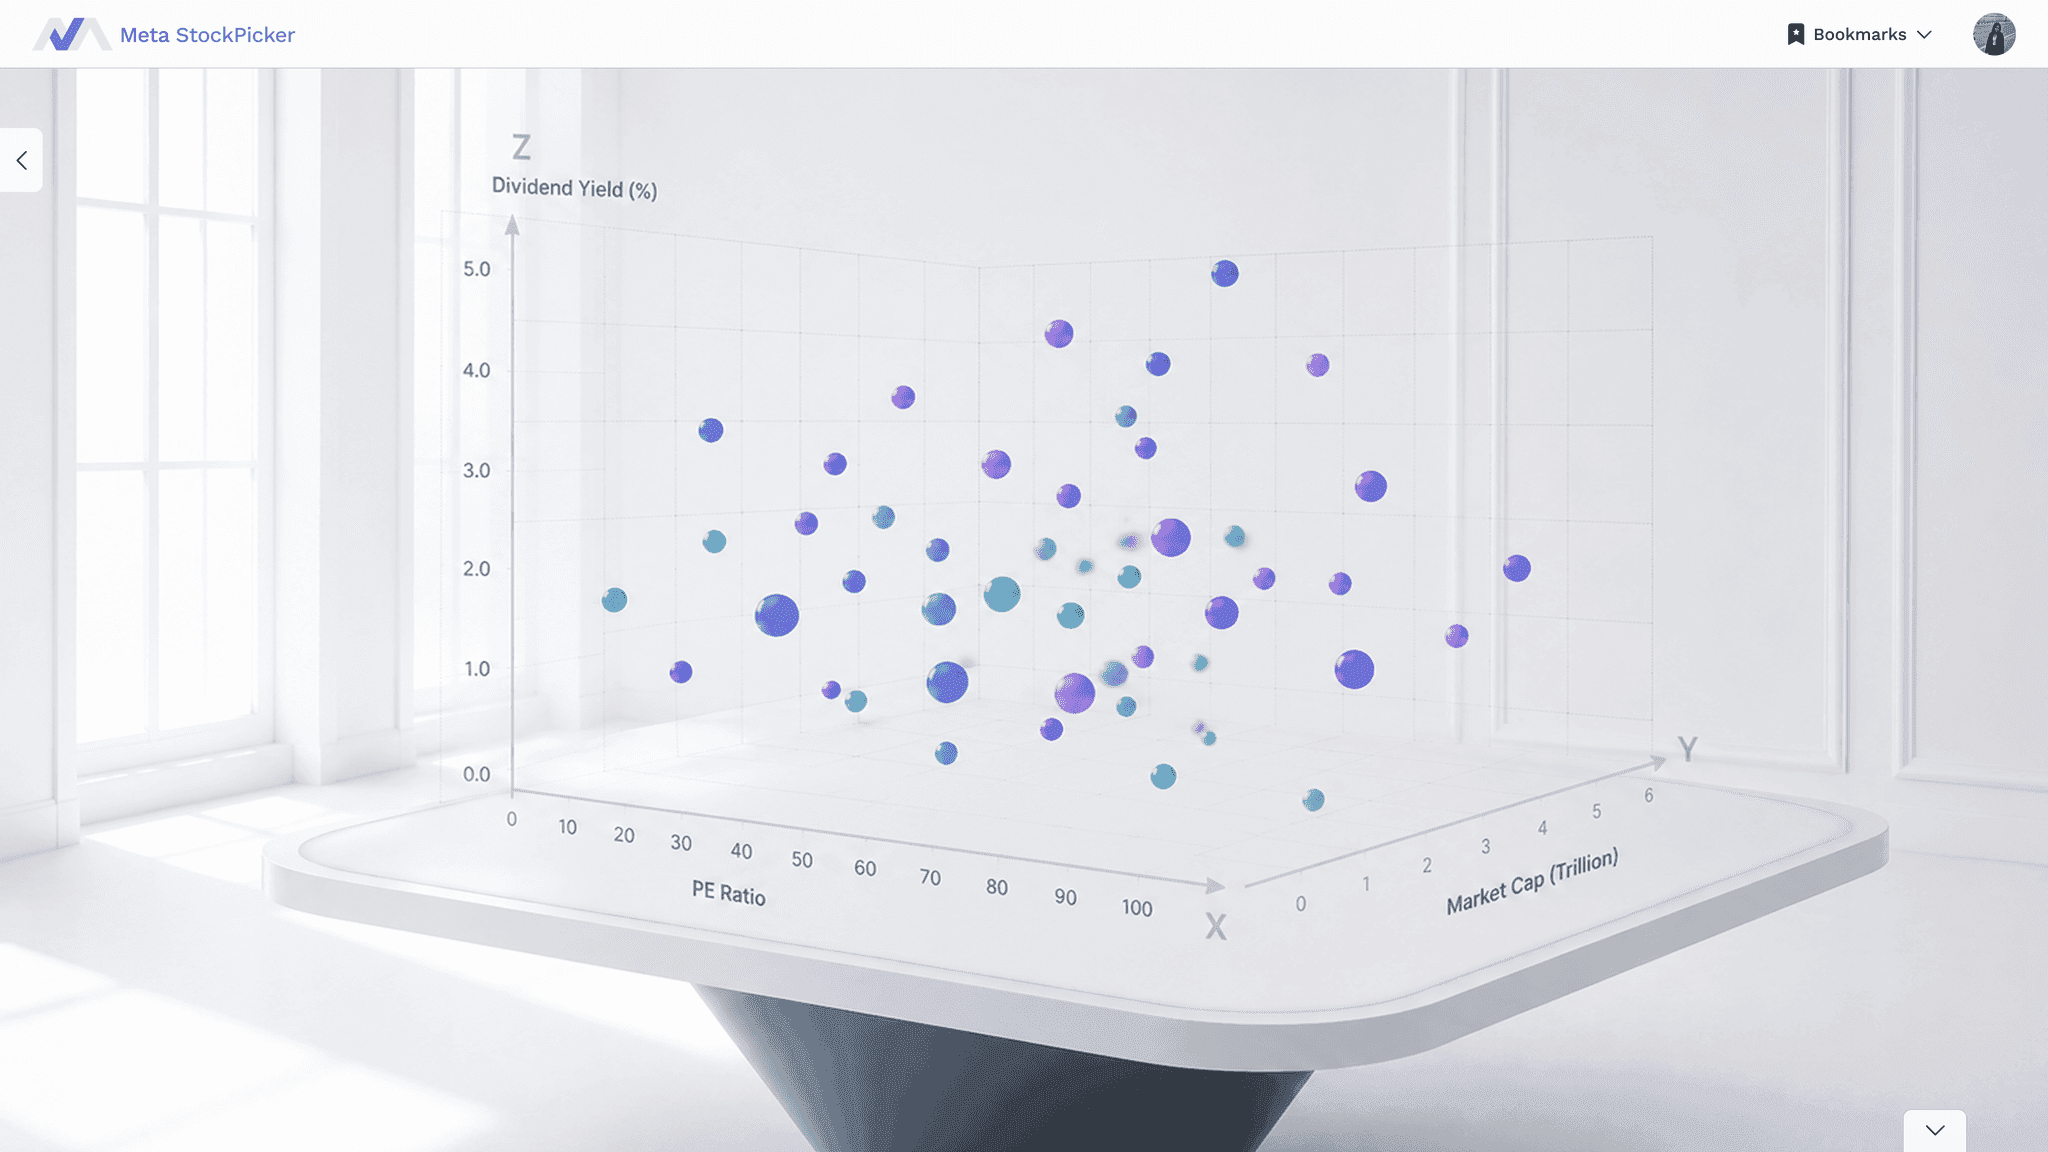
Users could spot patterns in the visualisation but had no table to quickly inspect the underlying stock data.
Impact
The multi-step process creates friction and interrupts the flow of exploration.
05 Secondary research
Media scan
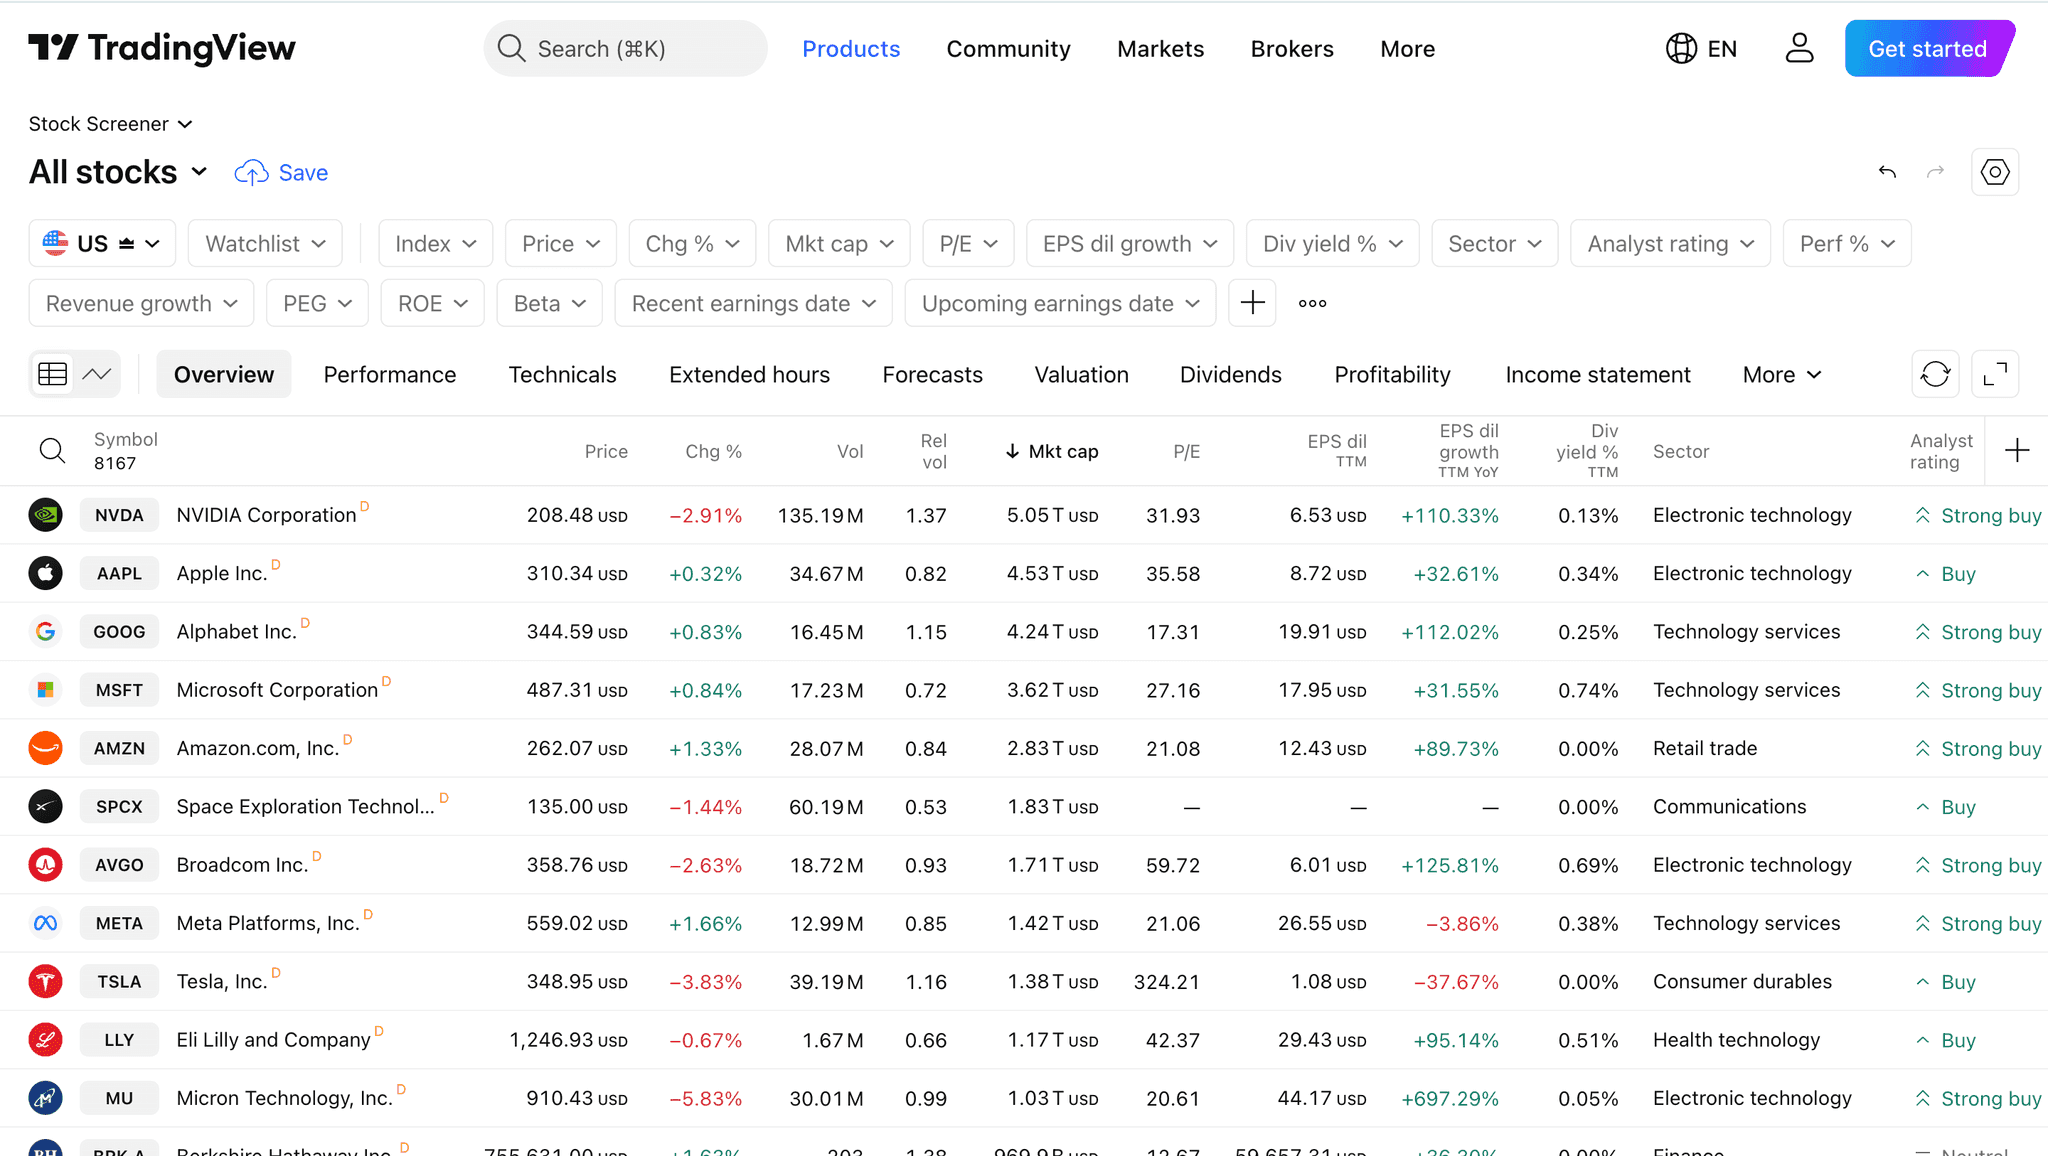
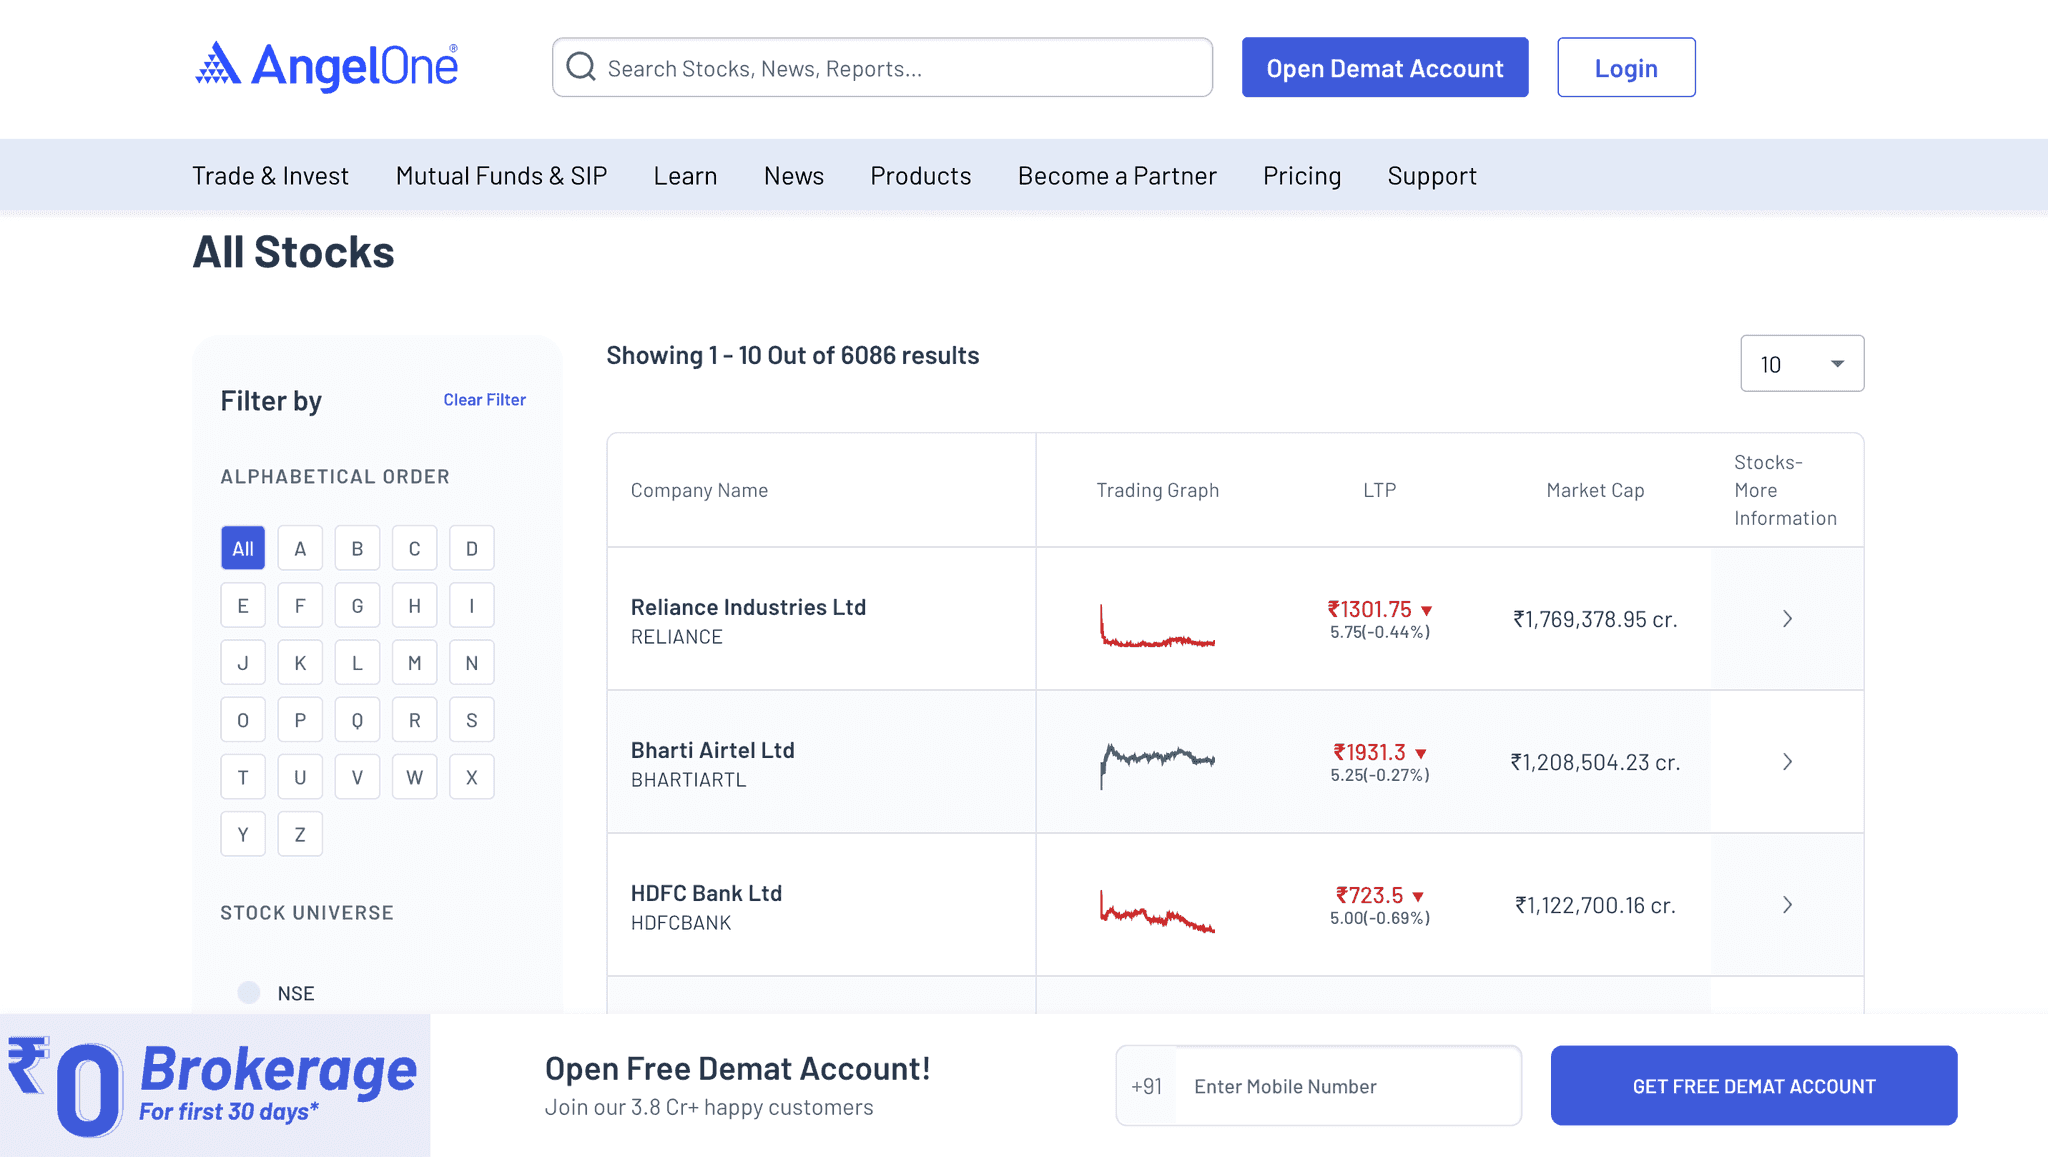
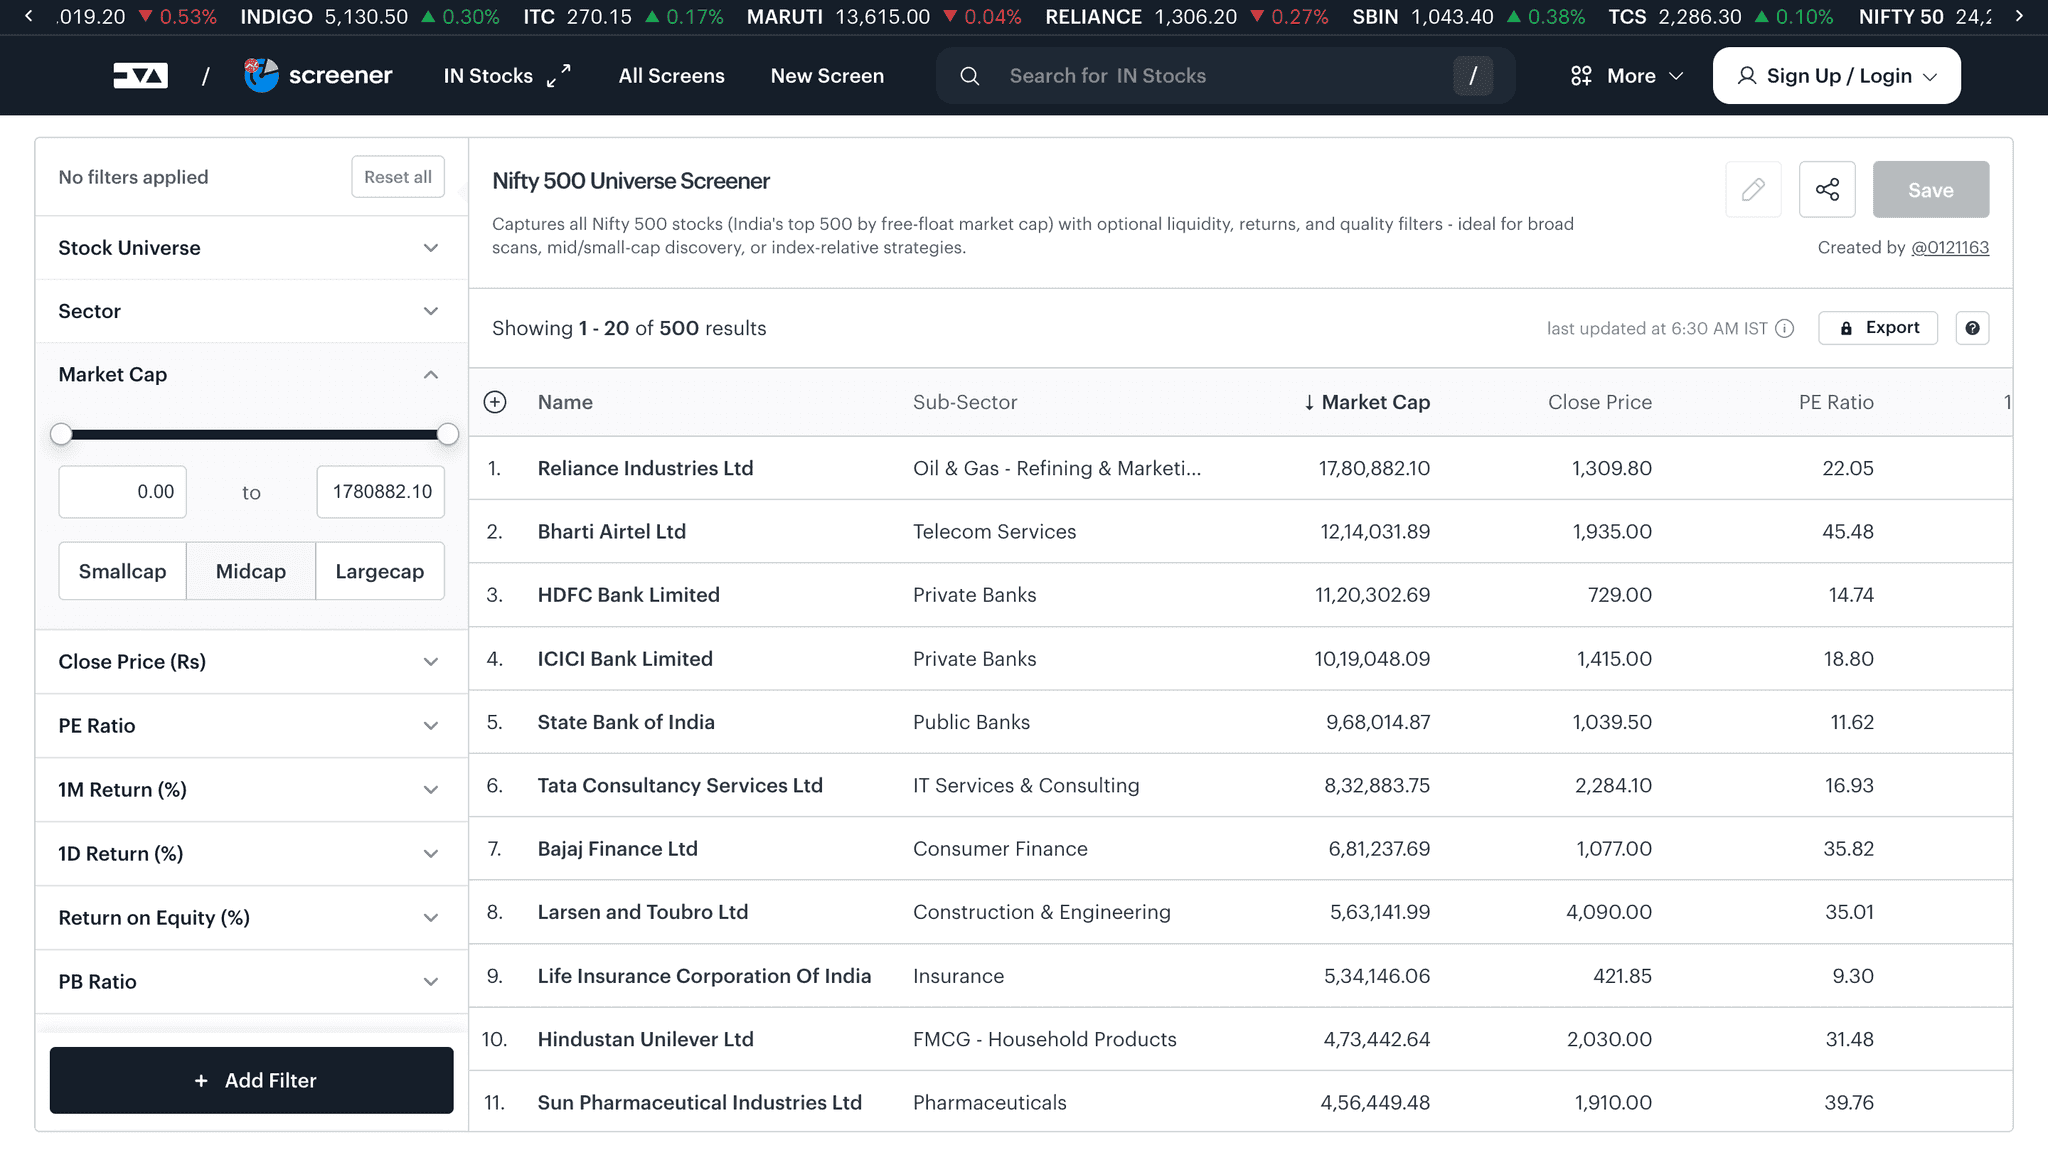
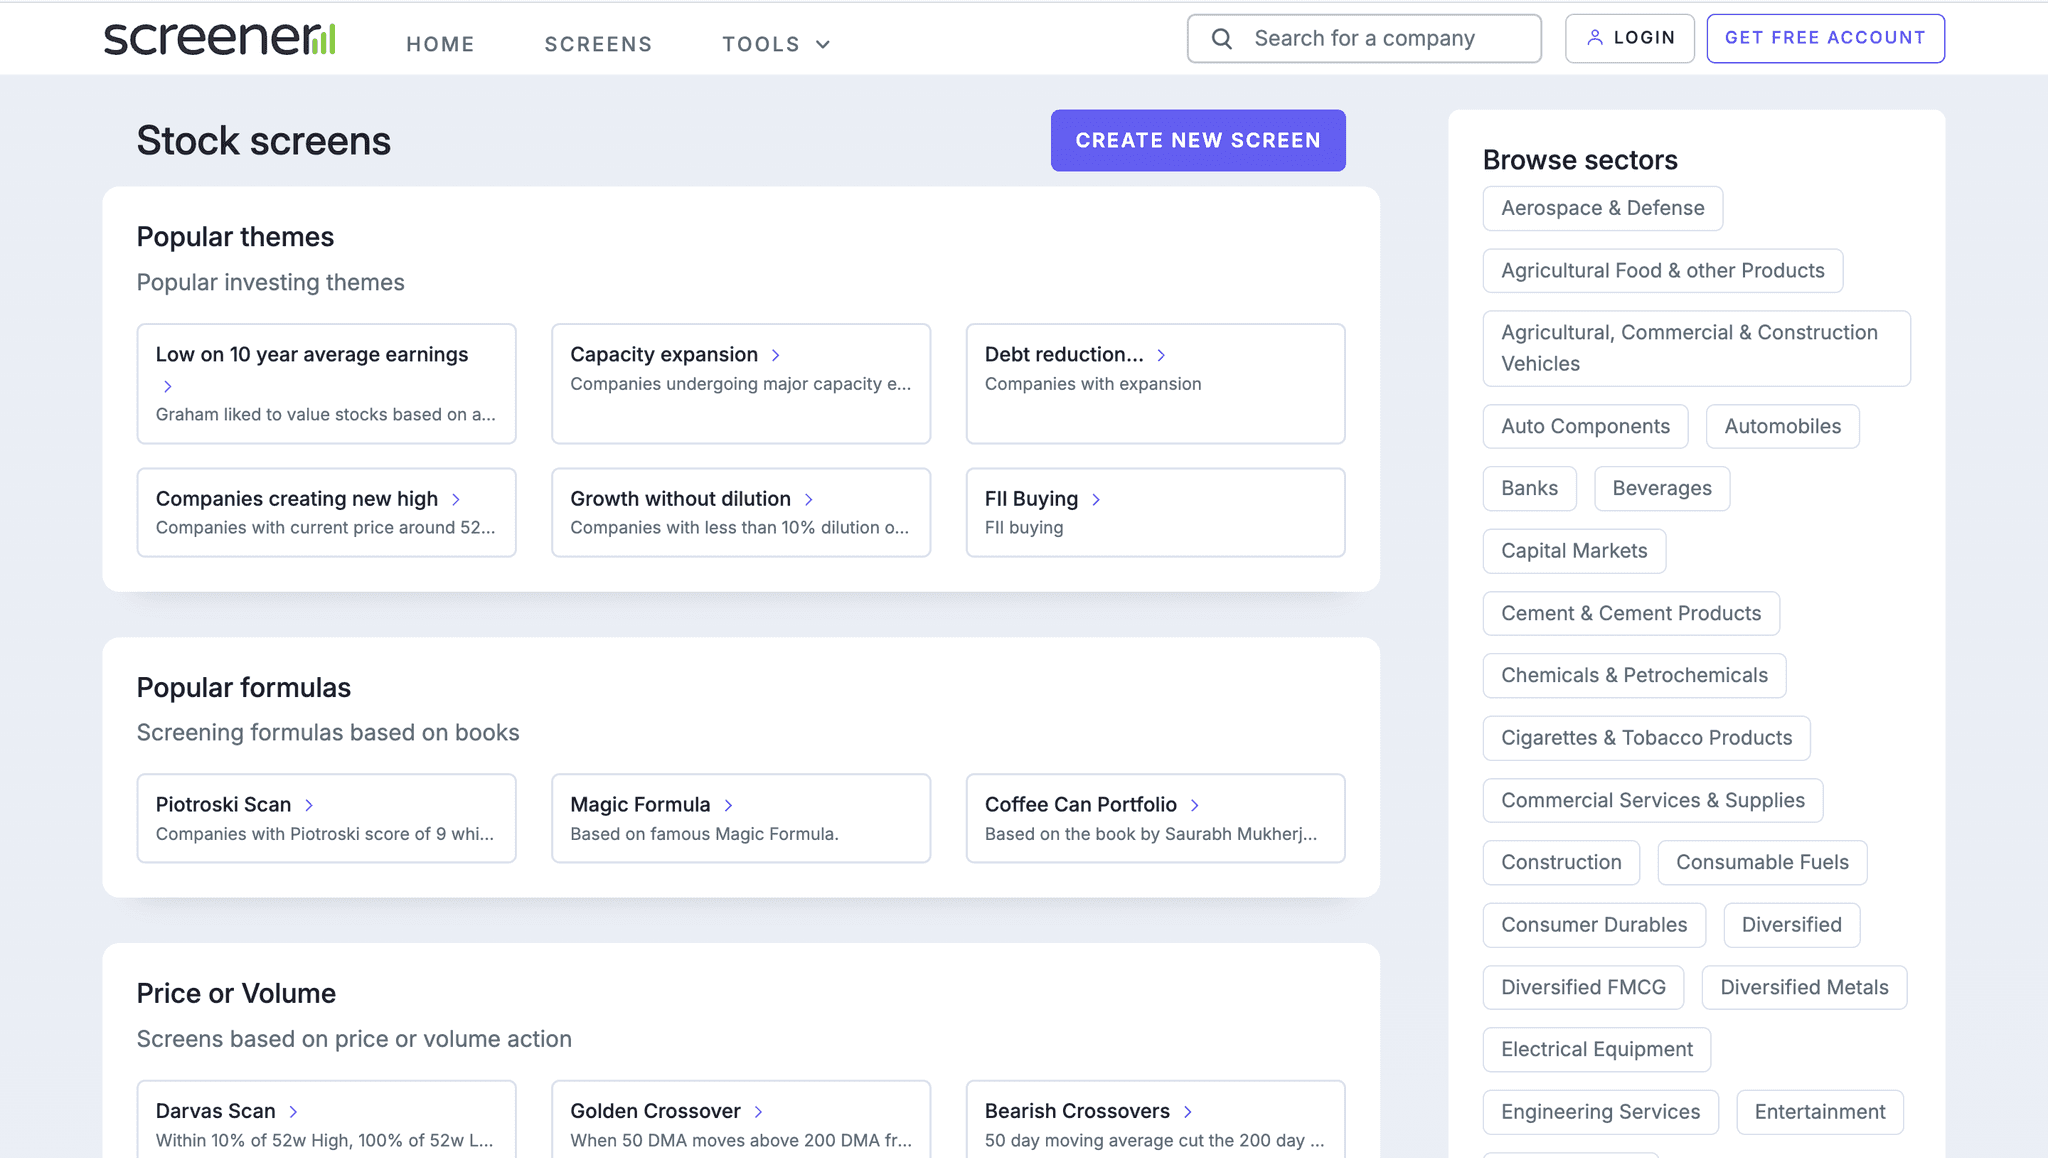
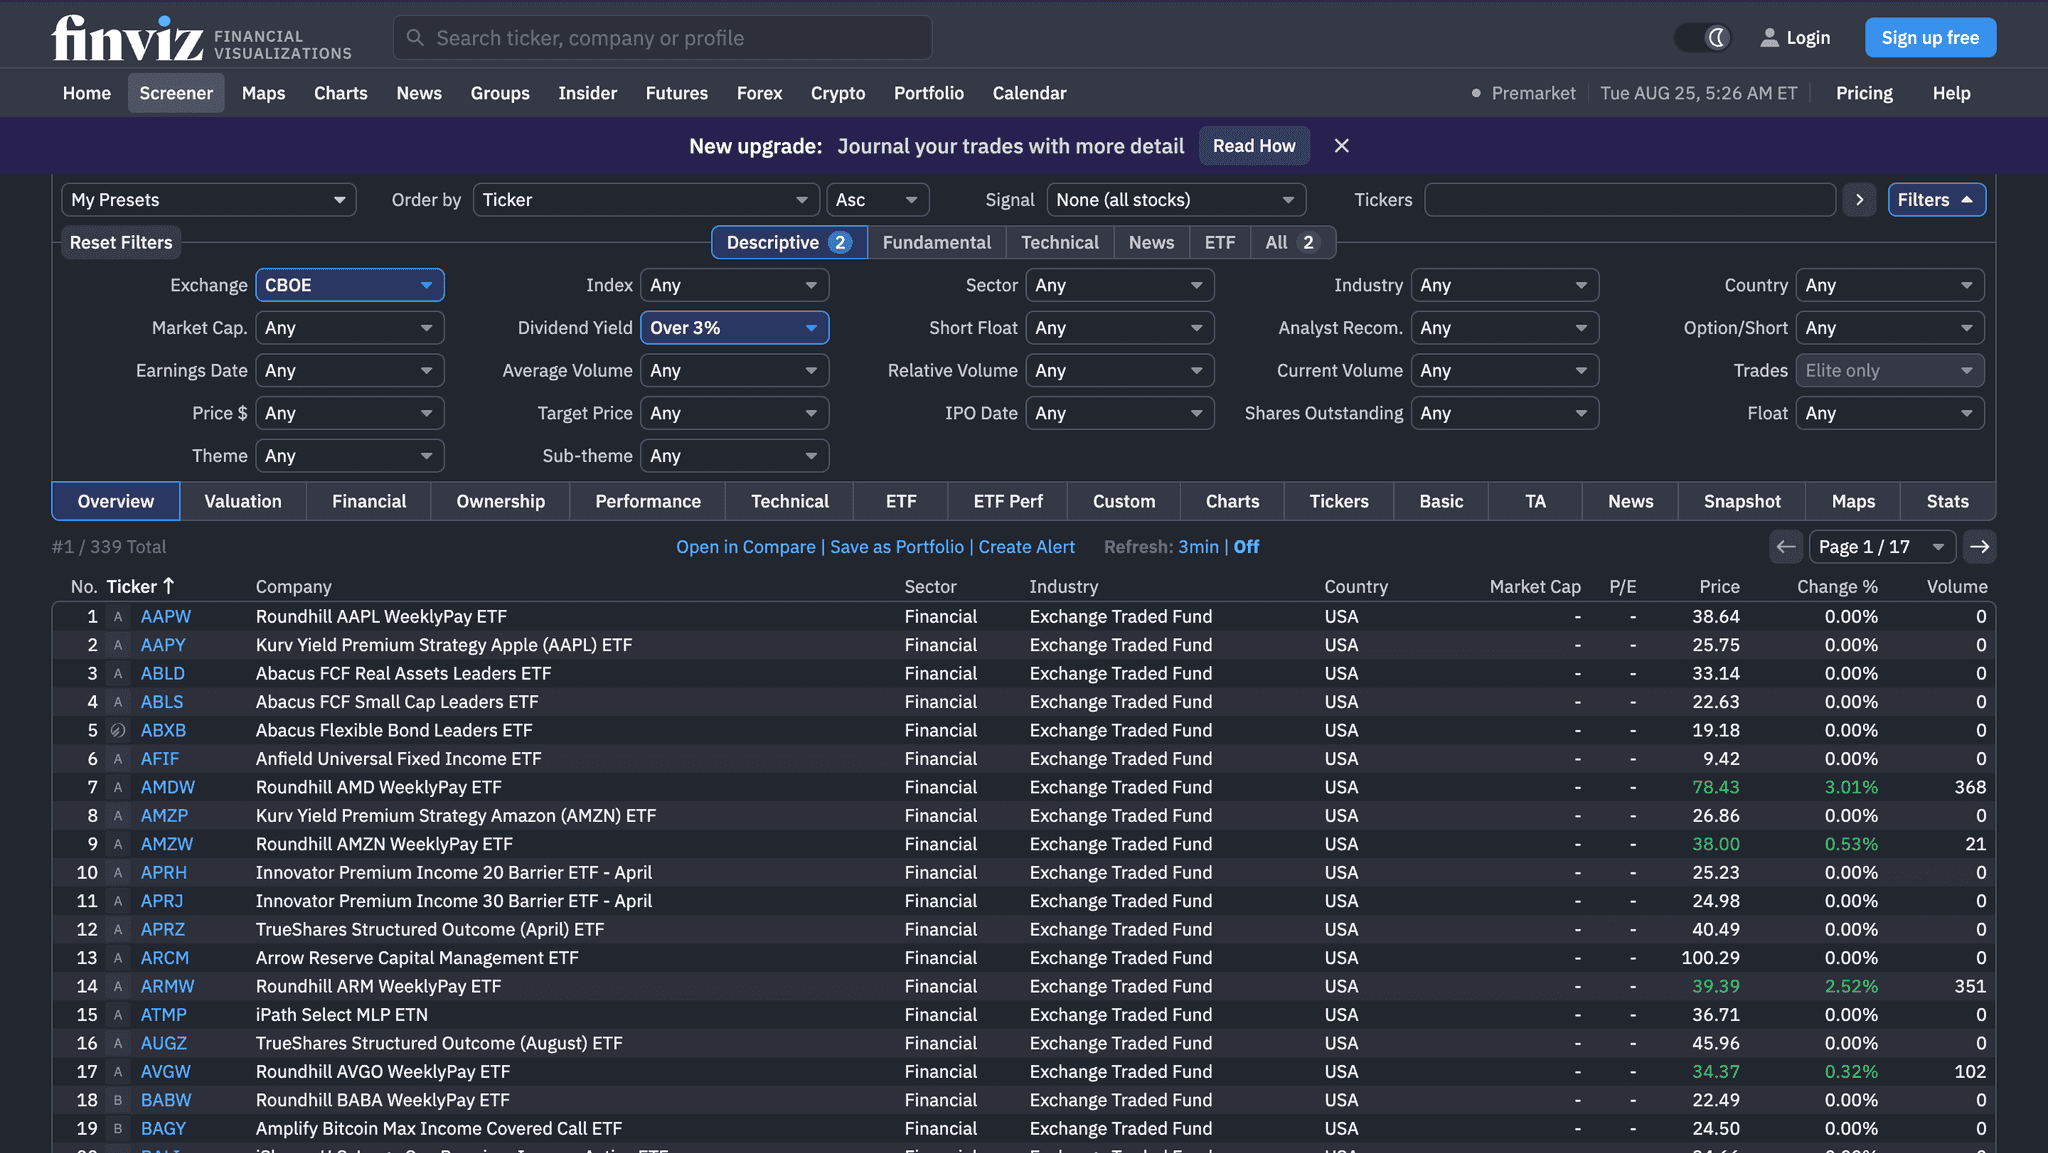
What I noticed
- AData-heavy tools keep supporting information close to the main visualization.
- BFiltering and exploration work better as one continuous flow.
- CTables make data easier to compare.
- DImportant actions should be easy to find.
- ESaved views reduce repeated setup.
06 Initial approach
First attempt: making each step easier
Iteration 01 — explored first, later replaced by the final solution
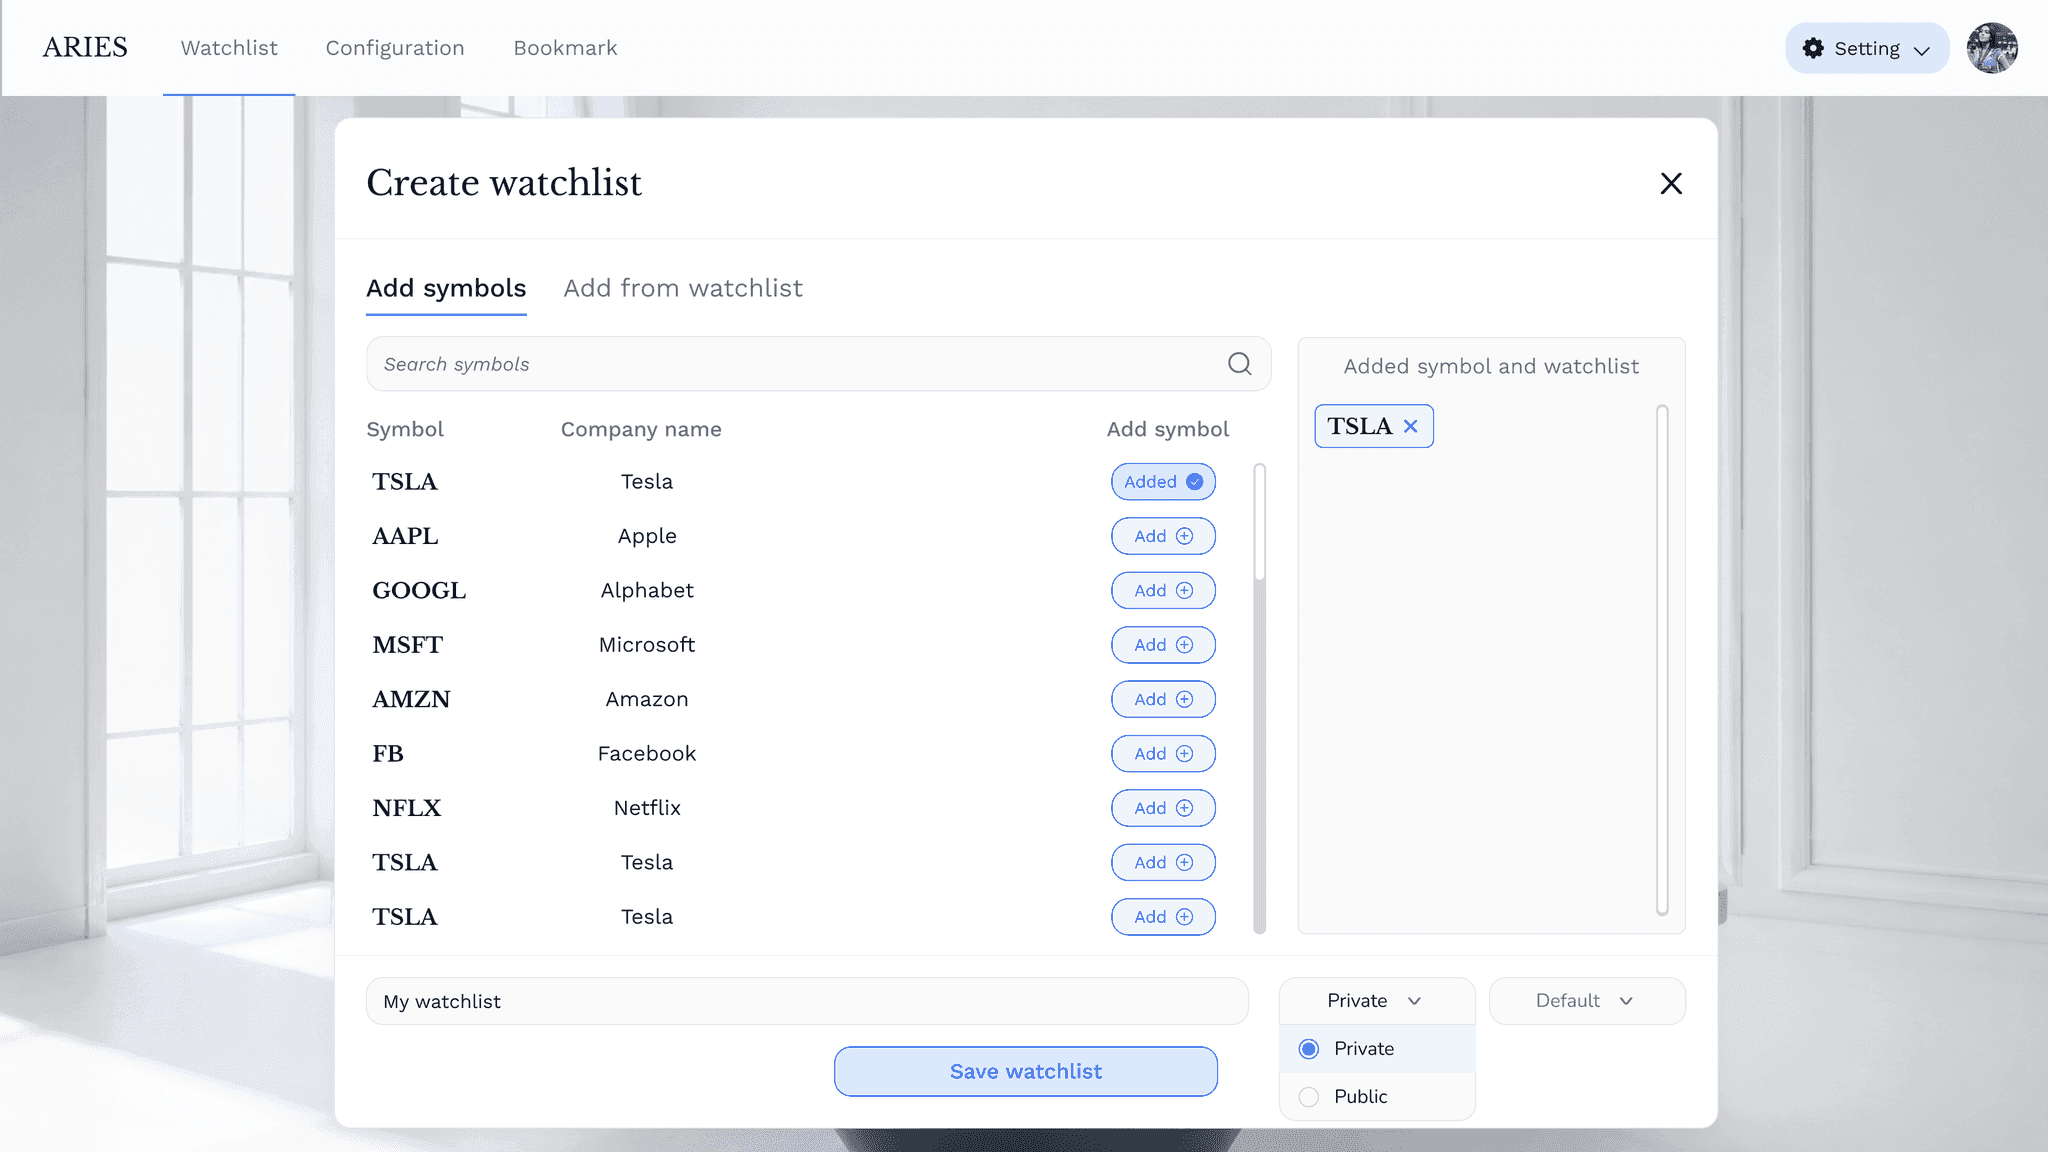
Added dedicated navigation for Watchlist, Configuration, and Bookmark, while widening the existing popups to display more data at once.
01Earlier, users had to return to the same section repeatedly to create or access a Watchlist, Configuration, or Bookmark. I separated these into dedicated navigation options so users could switch between them and start a new action more quickly.
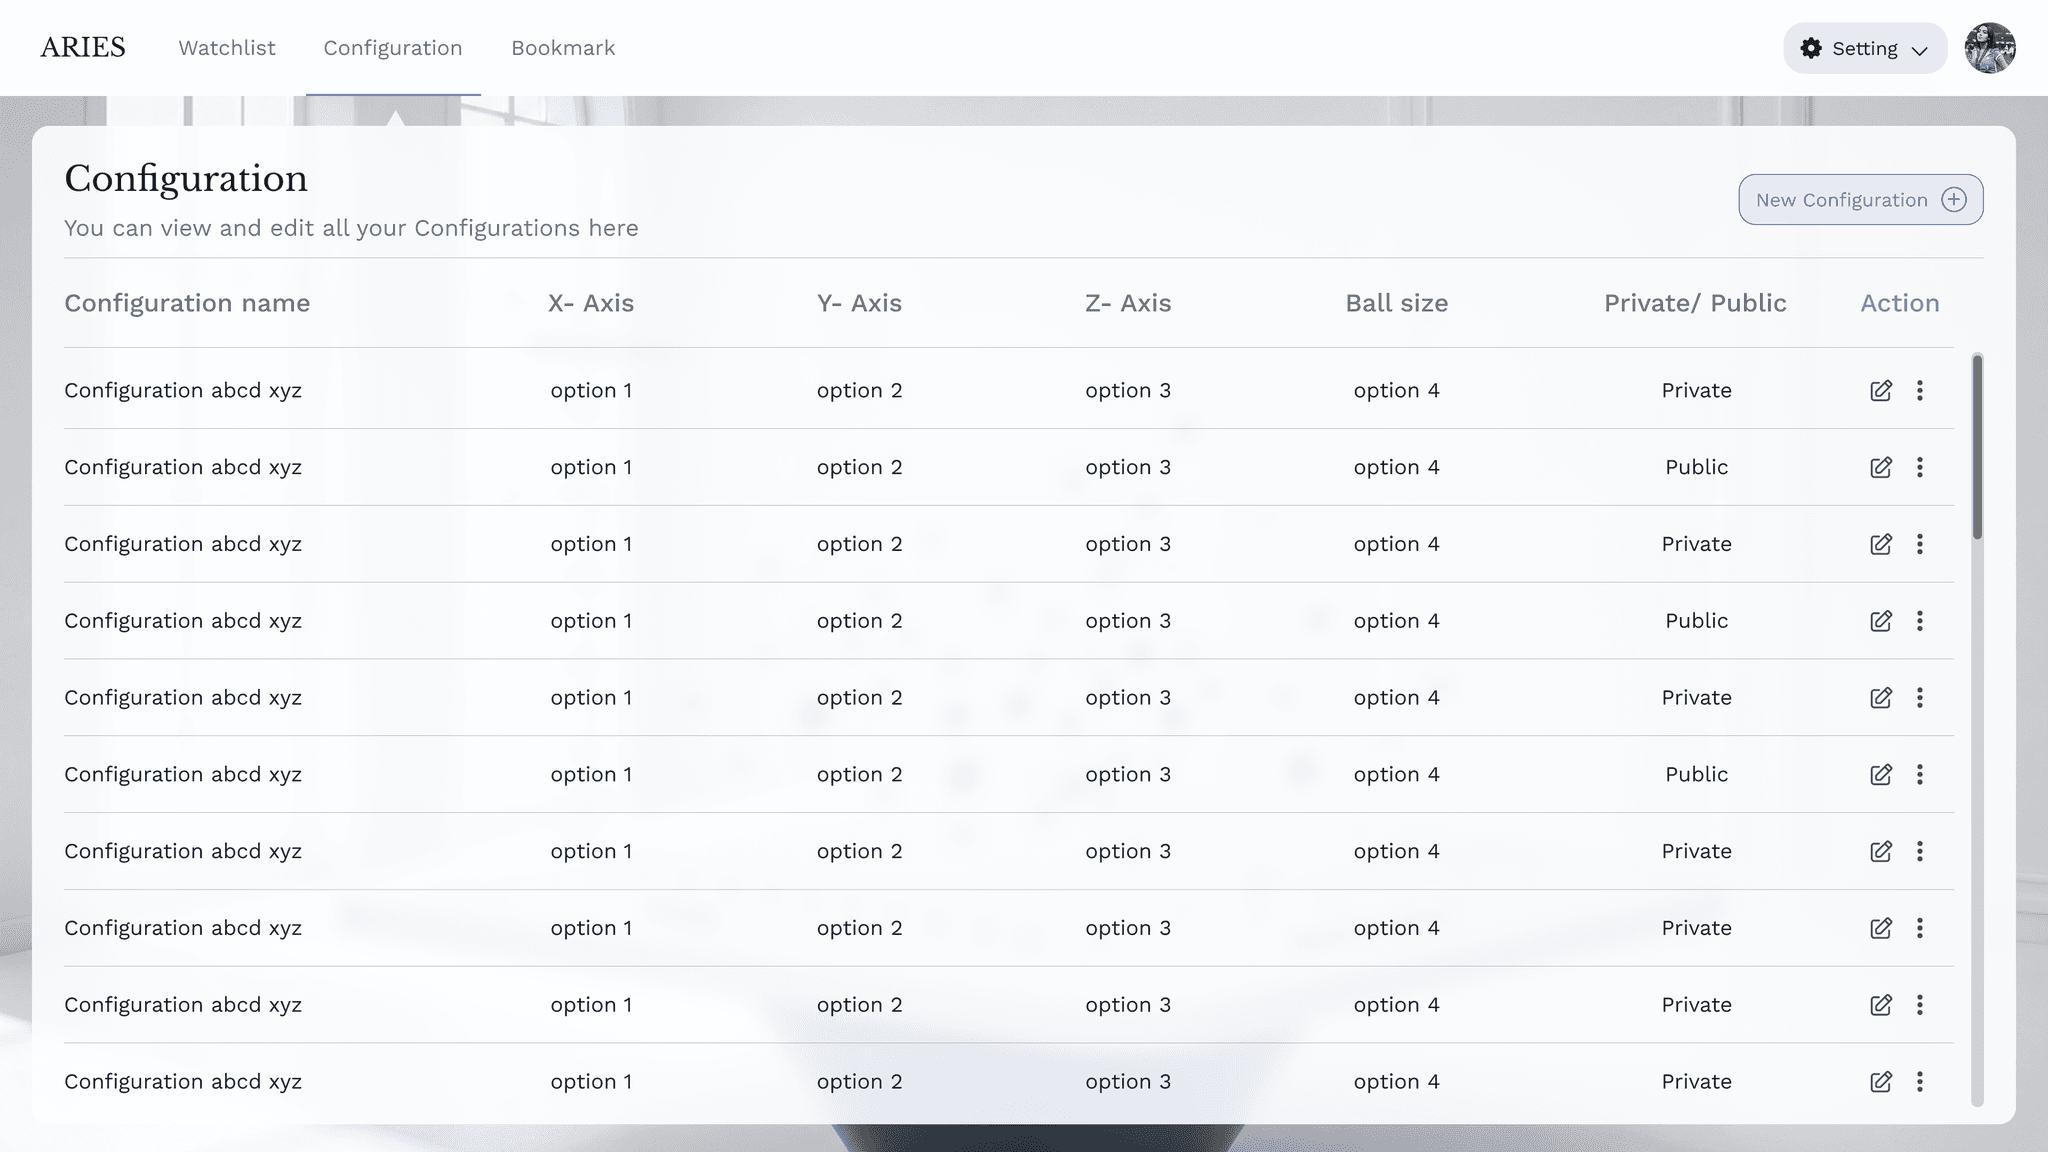
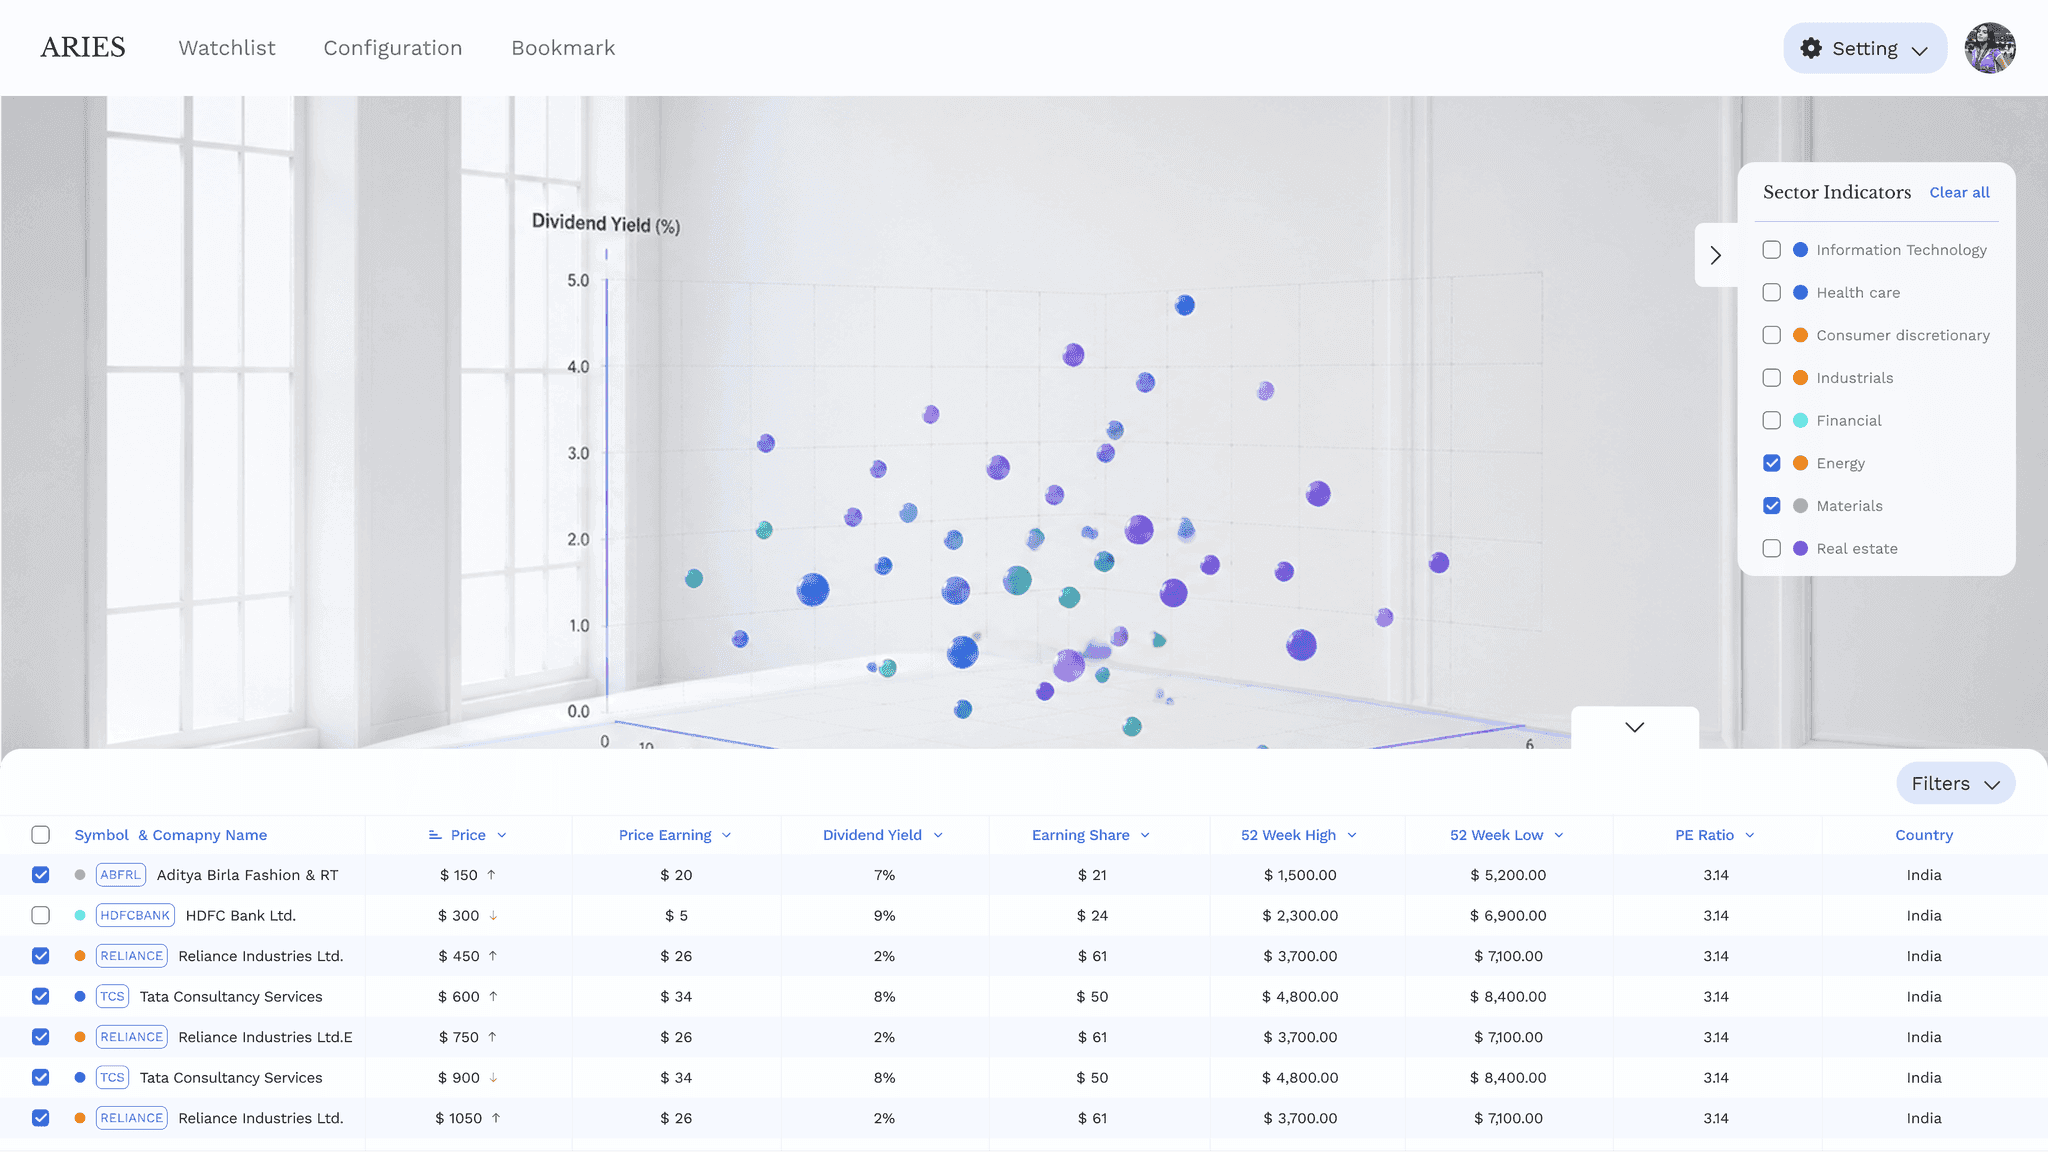
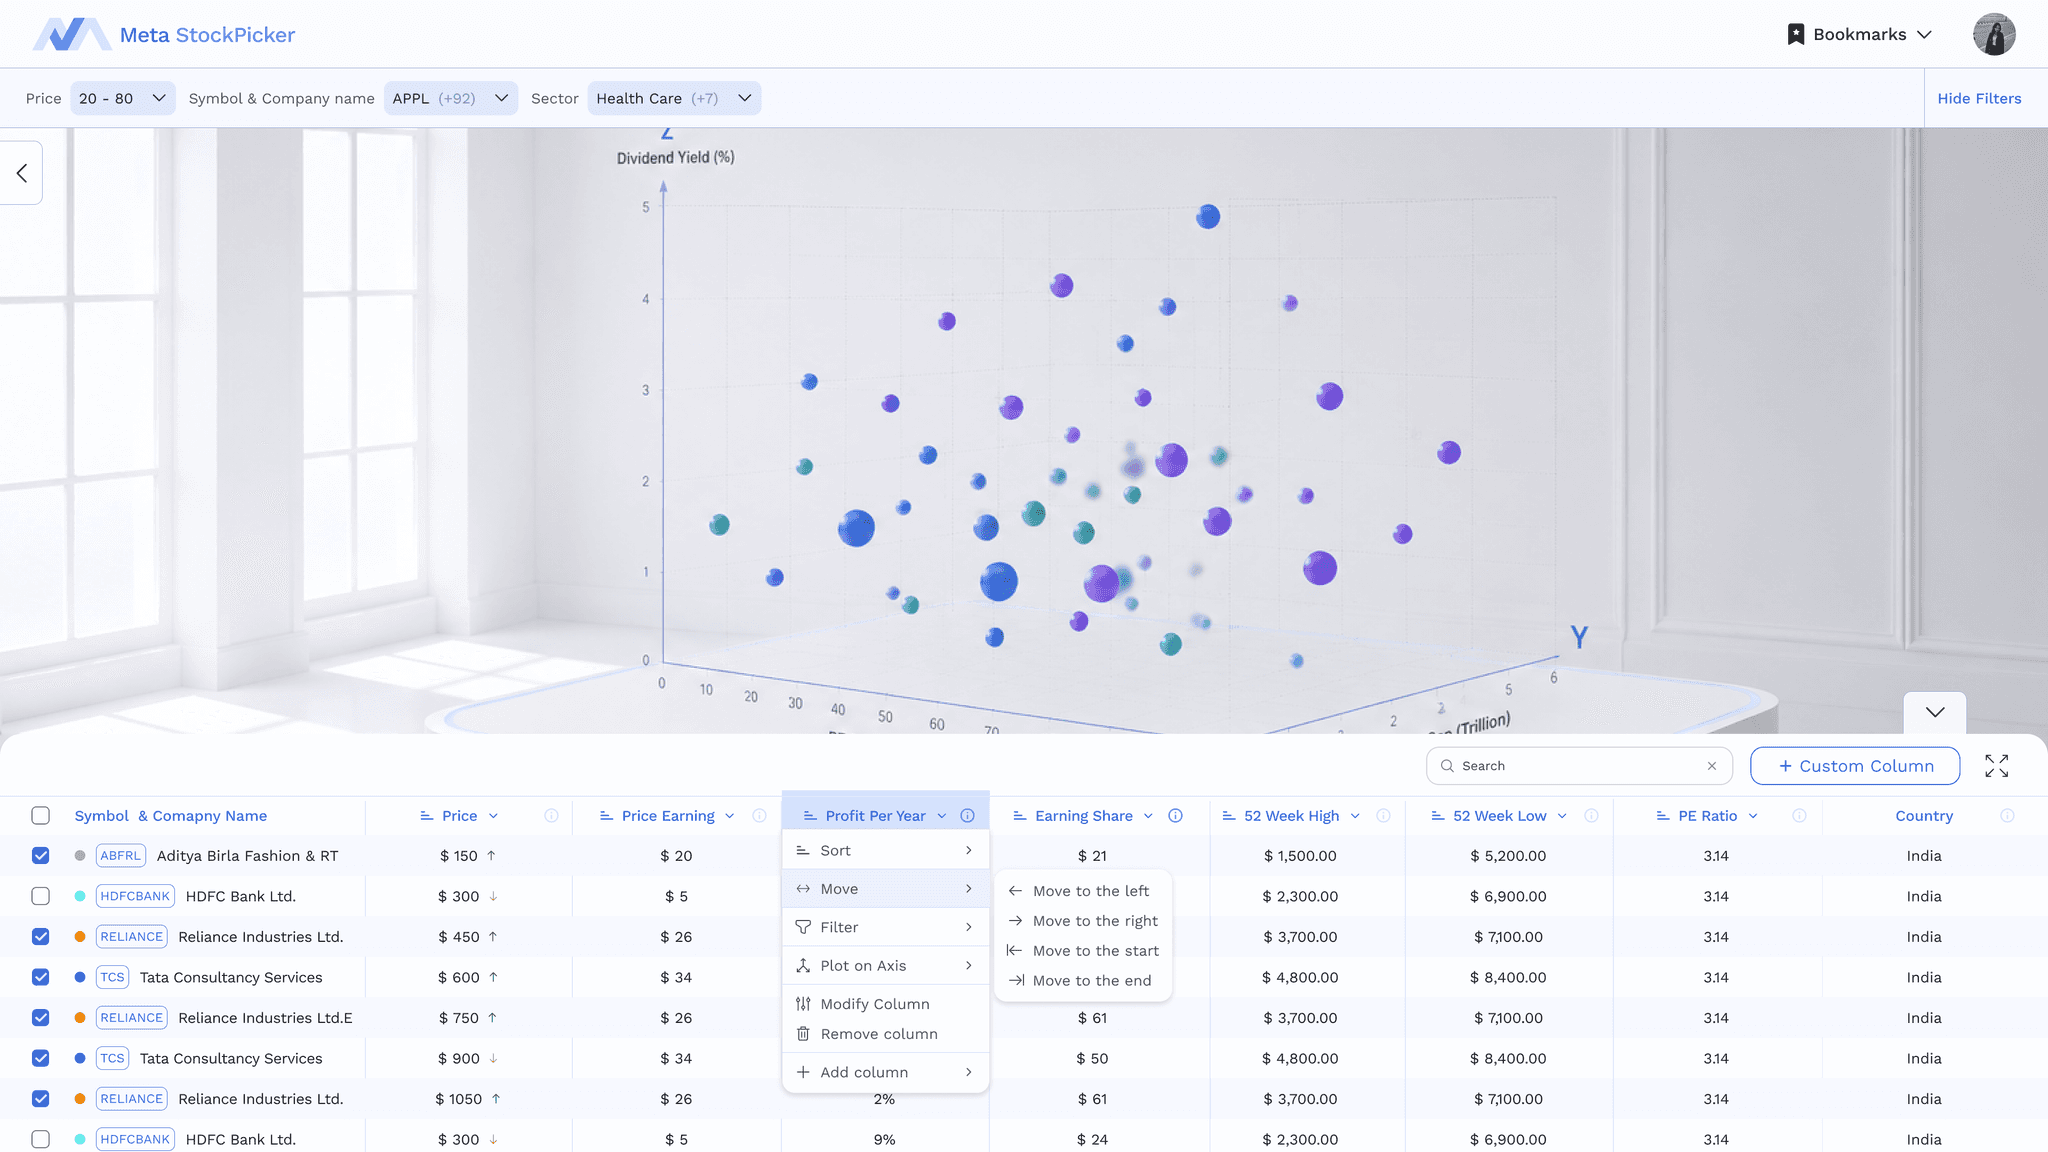
02I added a data table alongside the graph to make the underlying stock data visible while exploring. Filters were also introduced within the selected Bookmark, allowing users to narrow down stocks without leaving their current view.
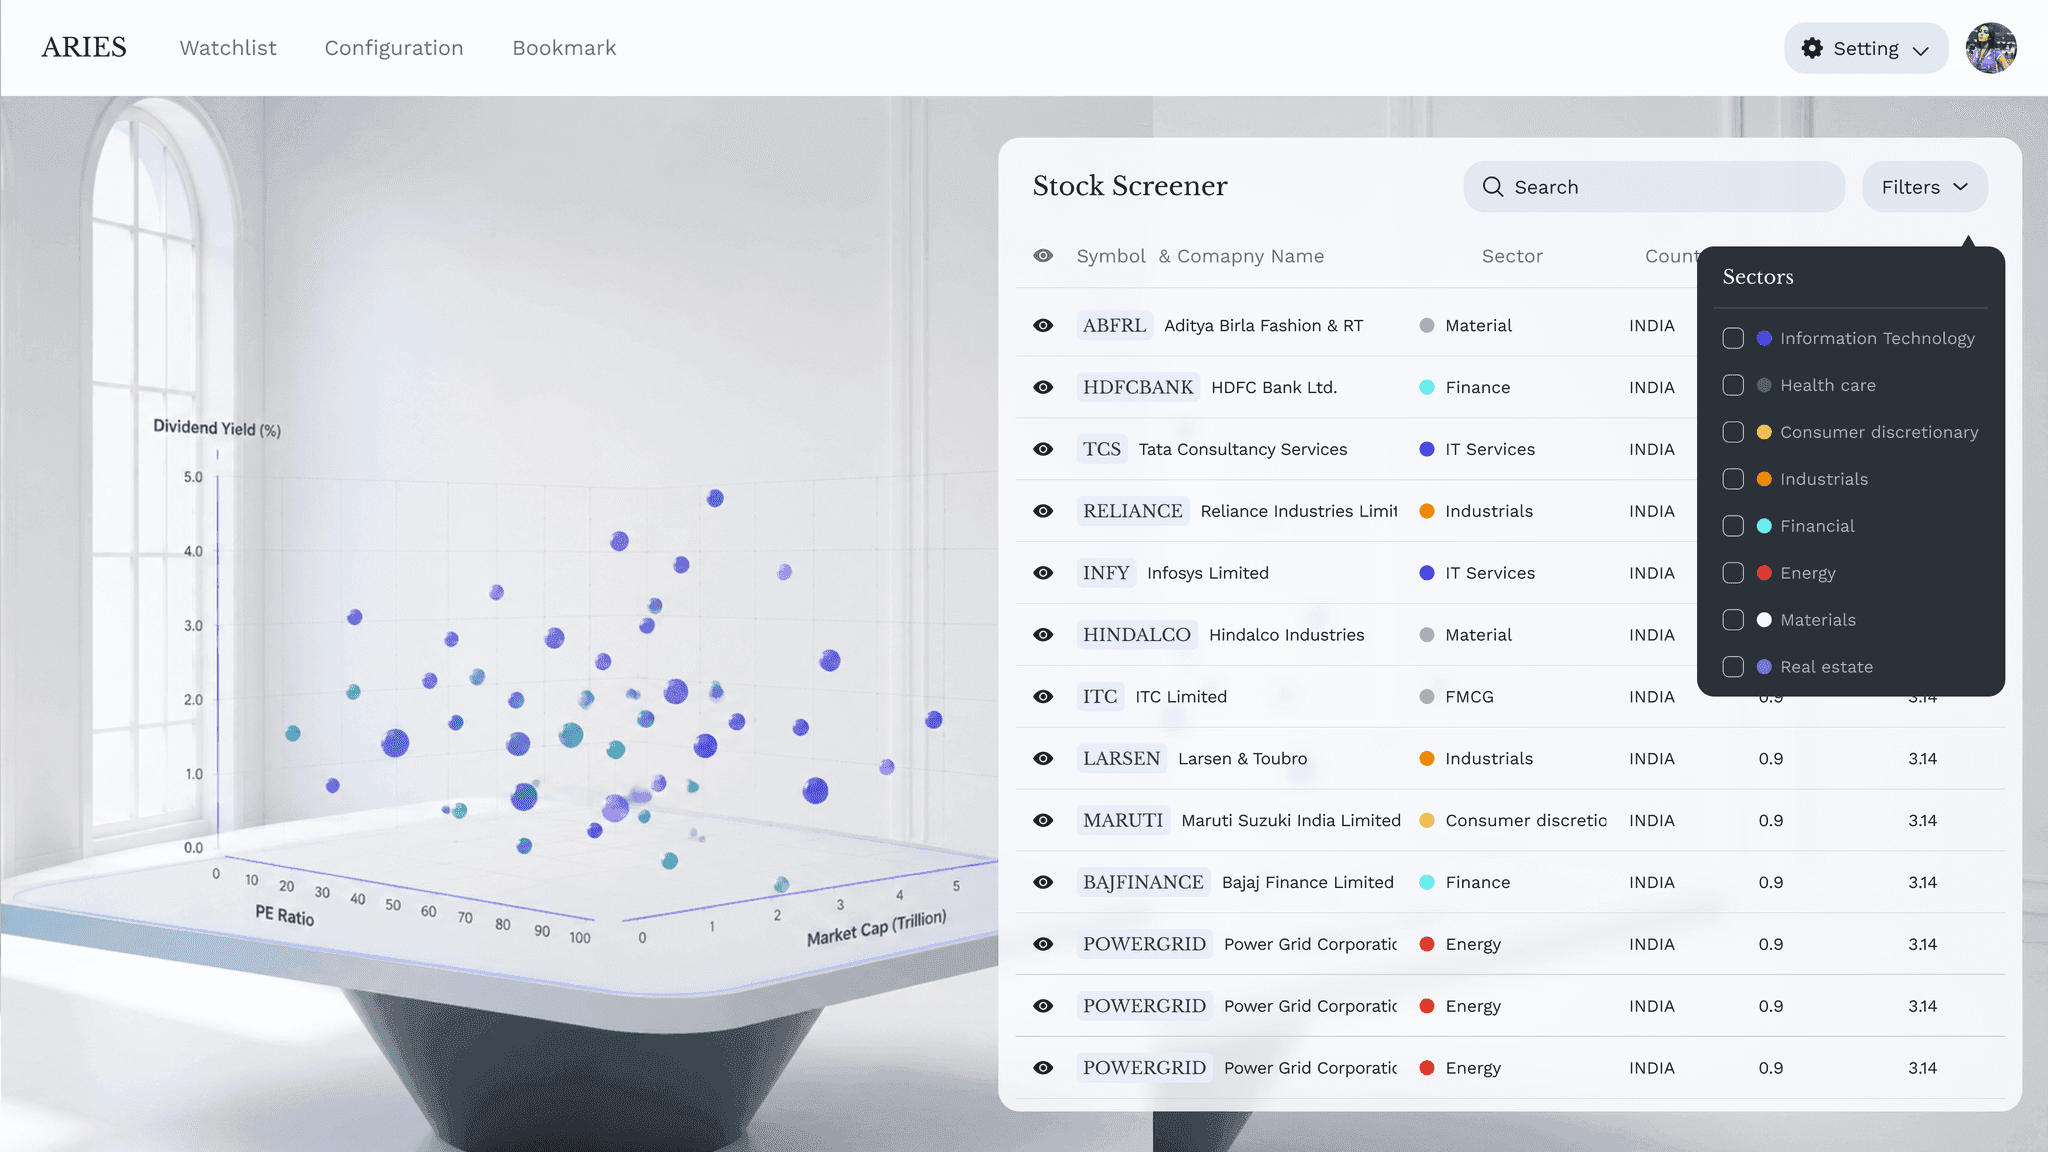
03The side-by-side layout competed for space and made the graph feel smaller. I moved the table below the visualisation so the graph could remain the primary focus while still keeping the supporting data accessible.
04The original popup was too small to comfortably review and add data. I widened and restructured the popup to give users more space to explore stocks and manage their selections without feeling cramped.
Key insight
Improving visibility wasn't enough.
The workflow itself was still fragmented, so I shifted the focus from making individual steps easier to reducing the number of steps altogether.
07 Final solution
Final solution
A single analysis workspace that brings filtering, configuration, data and saved views together.
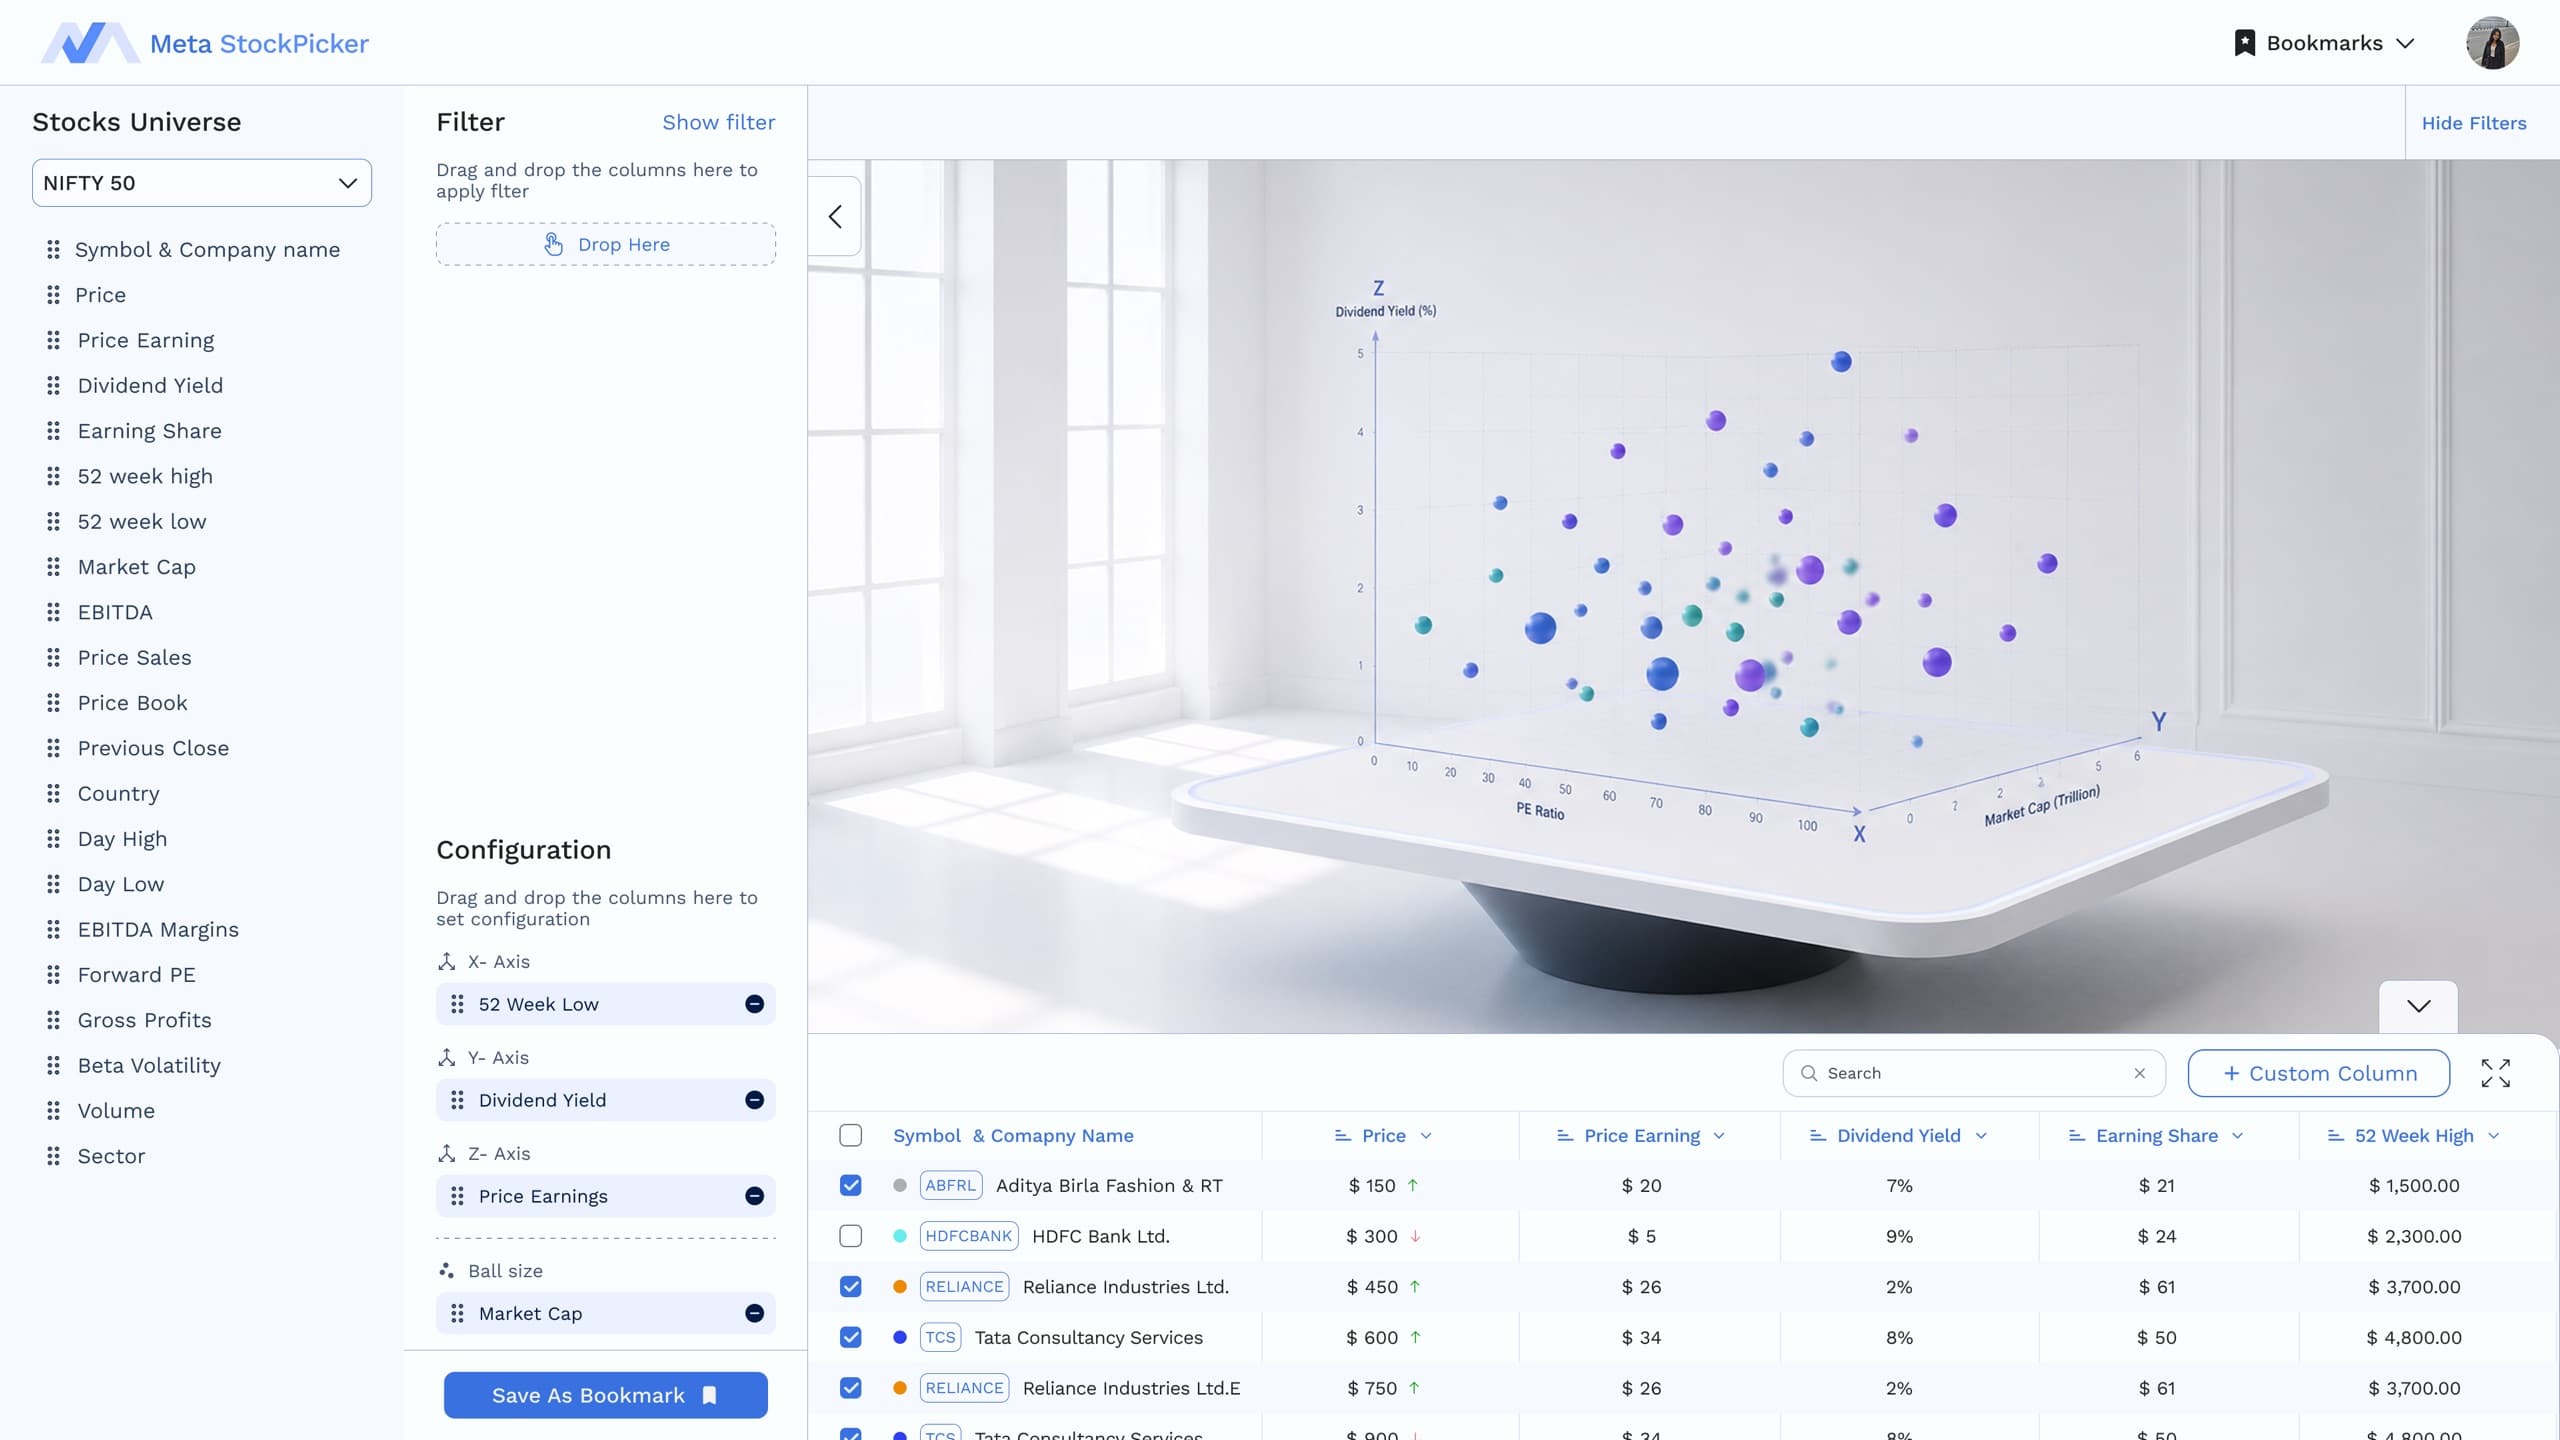
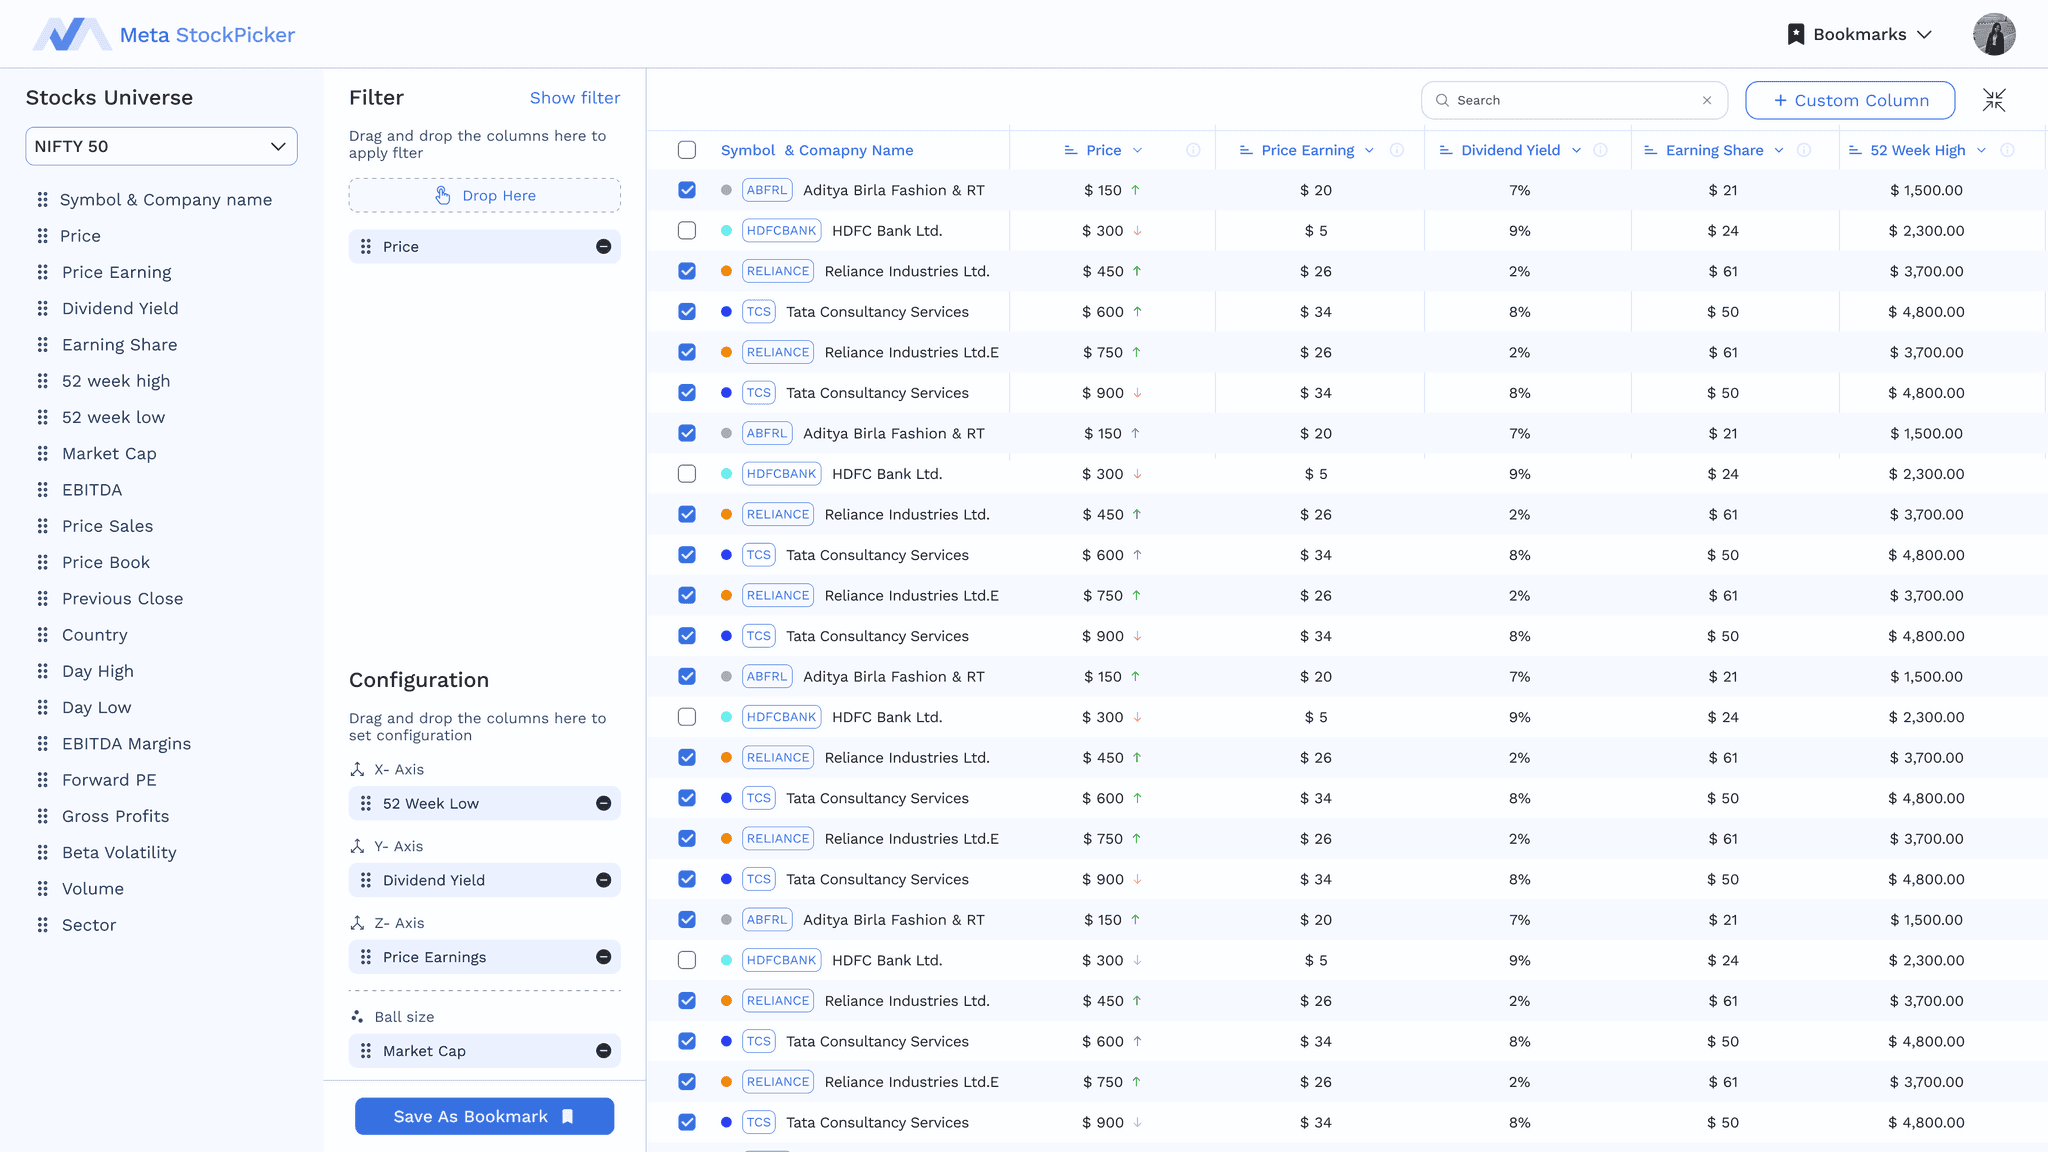
Replaced the Watchlist → Configuration → Bookmark workflow with a single exploration workspace. Users define their set of stocks by applying filters, configure the visualisation in the same space, explore the results in real time, and save the final state as a Bookmark when satisfied.
Old user flow
- 01Watchlist
- 02Configuration
- 03Bookmark
- 04Explore
Redesigned user flow
- 01Select Stock Set
- 02Filter
- 03Configure
- 04Save Bookmark
The redesign shifts the experience from “build first, explore later” to “explore, refine, and save.”
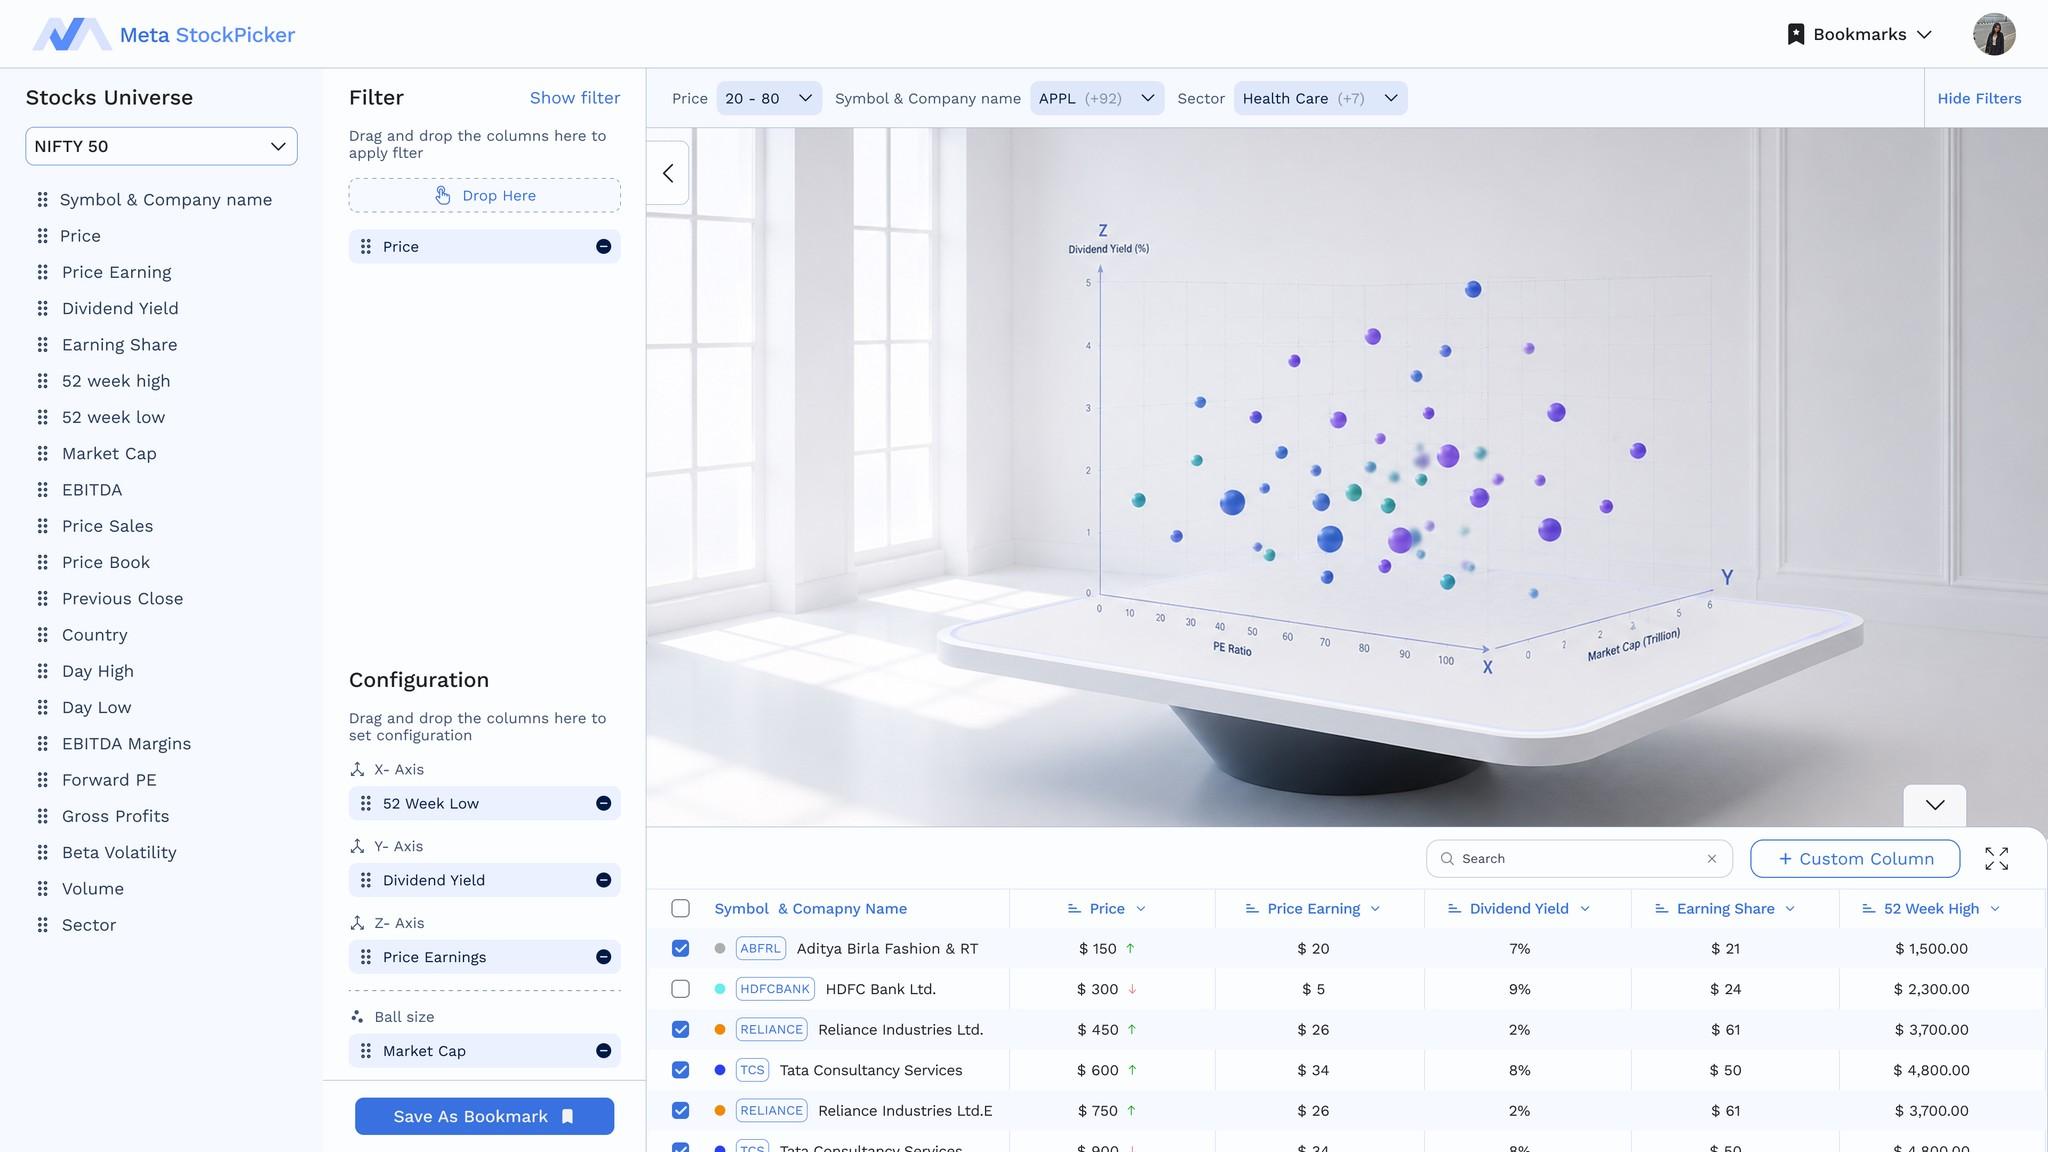
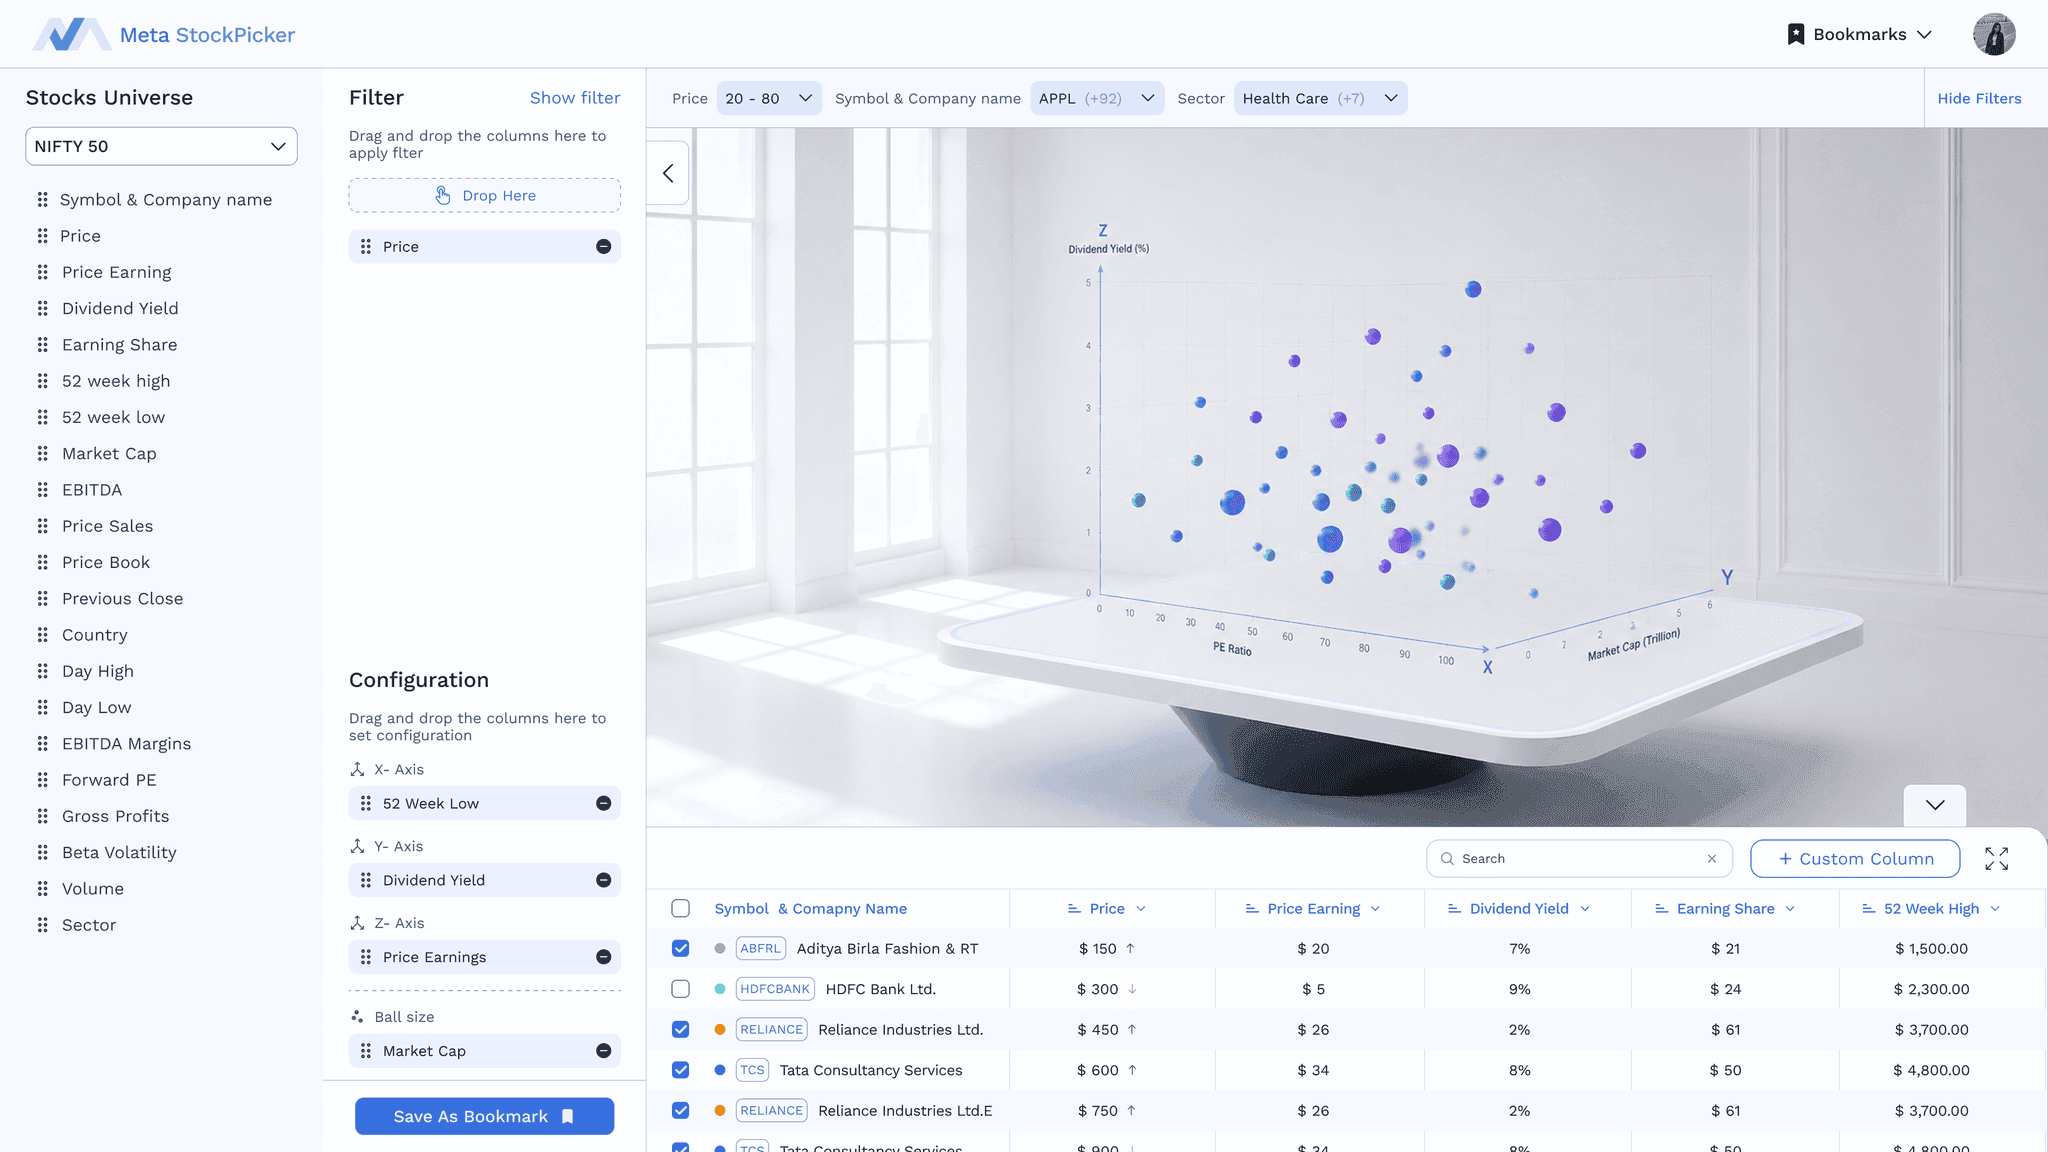
01 / 05Predefined stock sets give users a starting point for exploration, removing the need to create a Watchlist before they can begin.
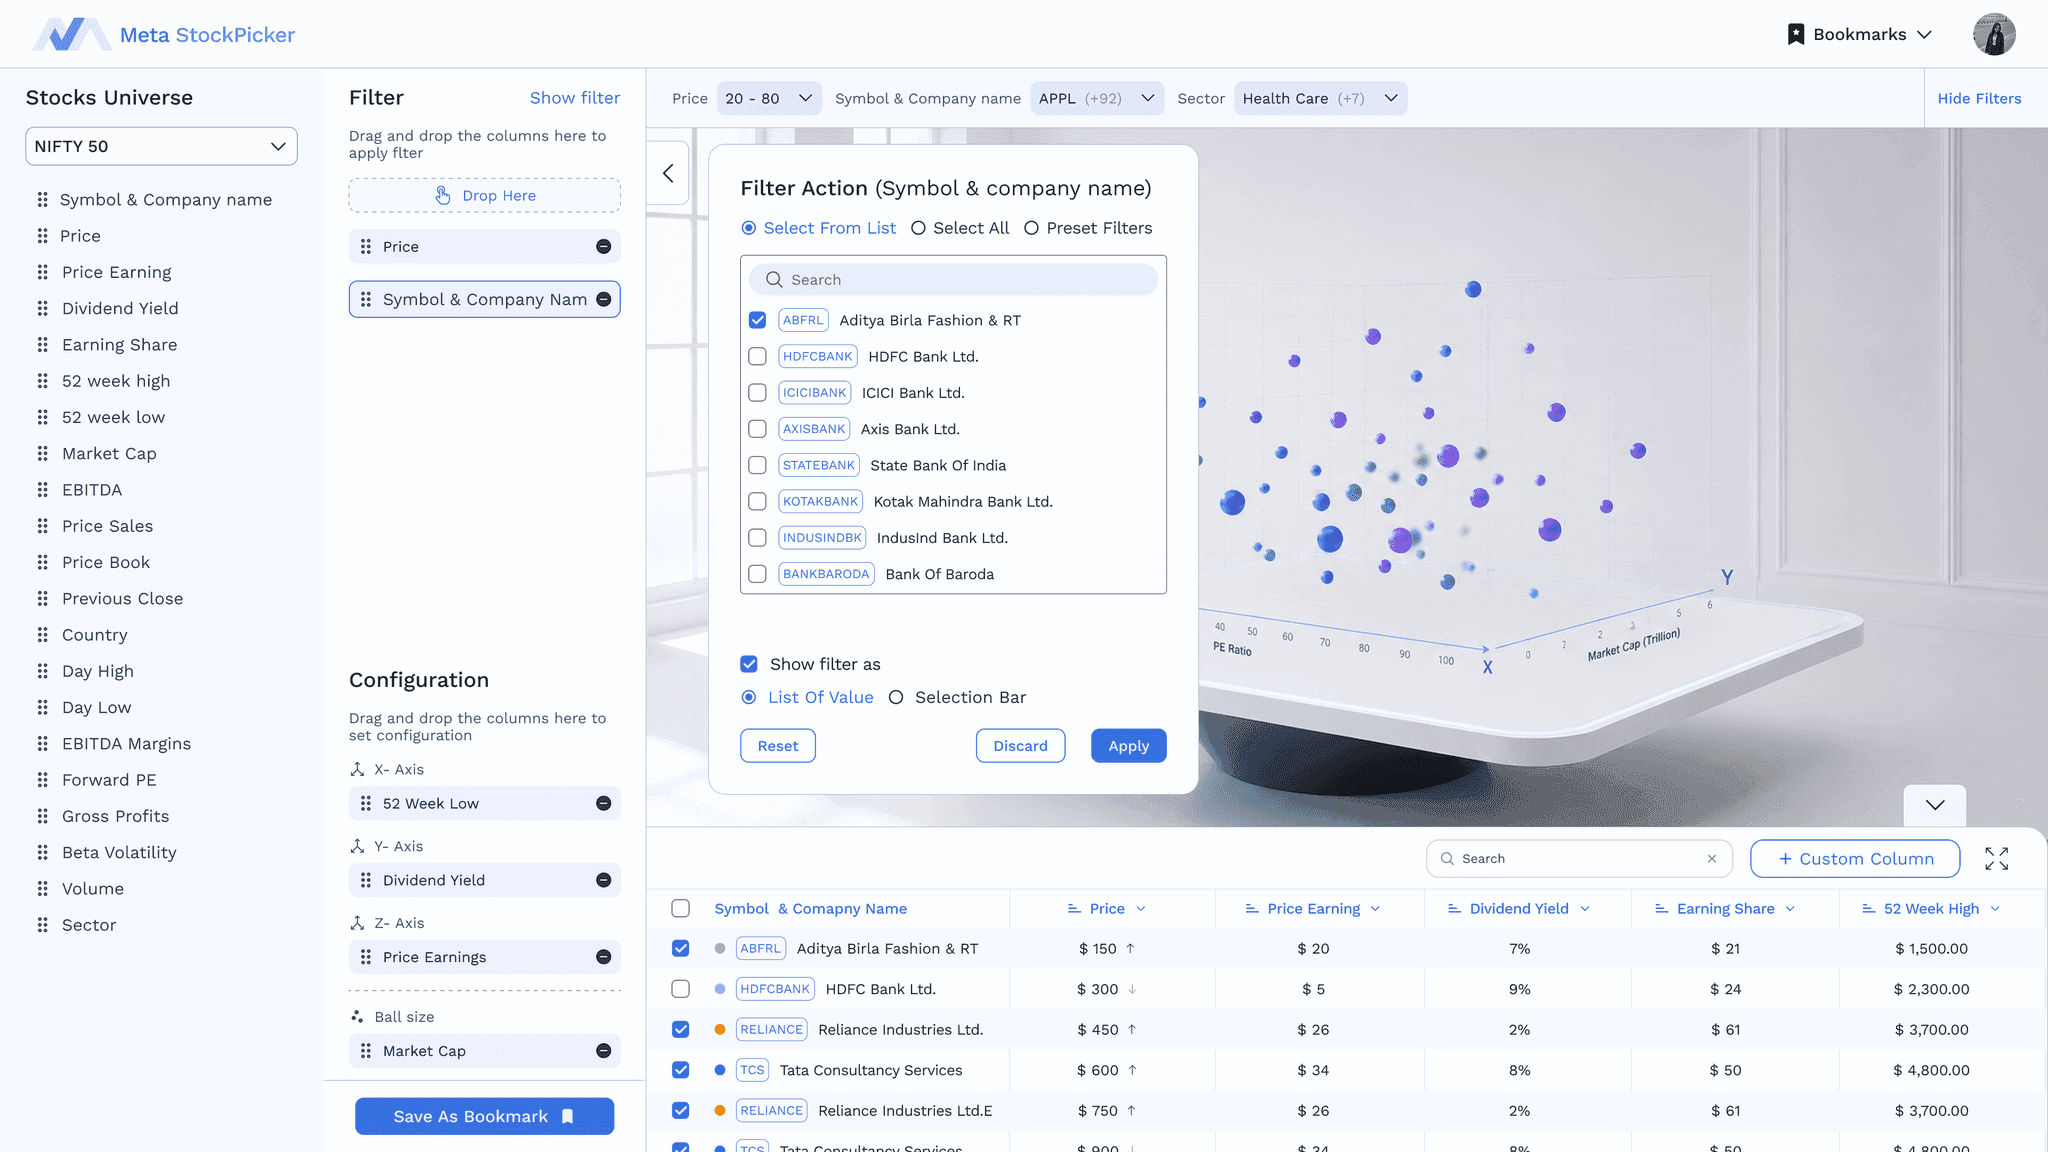
02 / 05Users can drag and drop columns to apply multiple filters and narrow down the stocks they want to analyse, replacing the old Watchlist creation step.
03 / 05Drag and drop metrics to configure the axes while keeping their filters and selected stocks visible in the same workspace.
04 / 05The graph and table update as users apply filters and change the configuration, making it easier to explore patterns and check the underlying data.
05 / 05Once satisfied with the filtered stocks and visualization, users can save the complete state as a Bookmark and return to it later.
08 Other screens
Other screens
09 Design outcomes
Design outcomes
- 01
Simplified workflow
Combined Watchlist + Configuration into a single saved analysis flow.
- 02
Improved data visibility
Introduced an integrated table so users can inspect the data behind the visualization.
- 03
Faster exploration
Moved filtering and configuration into the analysis workspace instead of separate creation flows.
10 Prototype
Prototype